Triglyceride to HDL Ratio as an Insulin Resistance Proxy
A simple lipid ratio flags insulin resistance that standard tests routinely miss.

A lipid panel comes back marked "normal," and the person reading it closes the folder and moves on, when the same two numbers on that page already contain a signal nobody taught them to read. Insulin resistance drives type 2 diabetes, cardiovascular disease, and metabolically associated fatty liver disease, yet almost nobody gets it measured directly. The real test for insulin resistance, a hyperinsulinemic euglycemic clamp, only happens in research labs. The everyday substitute, HOMA-IR, needs a fasting insulin blood draw that most primary care offices never order unless a doctor asks for it specifically. The IDF Diabetes Atlas, in its 11th edition published in 2025, shows that a large share of diabetes cases around the world go undiagnosed; the insulin resistance behind them keeps doing damage for years before anyone names it. The dysfunction is there and it can be measured. The real question is whether a tool exists that's cheap enough and common enough to catch it routinely, and that's where a simple ratio from a standard lipid panel starts to matter.
How insulin resistance produces the TG/HDL pattern mechanistically
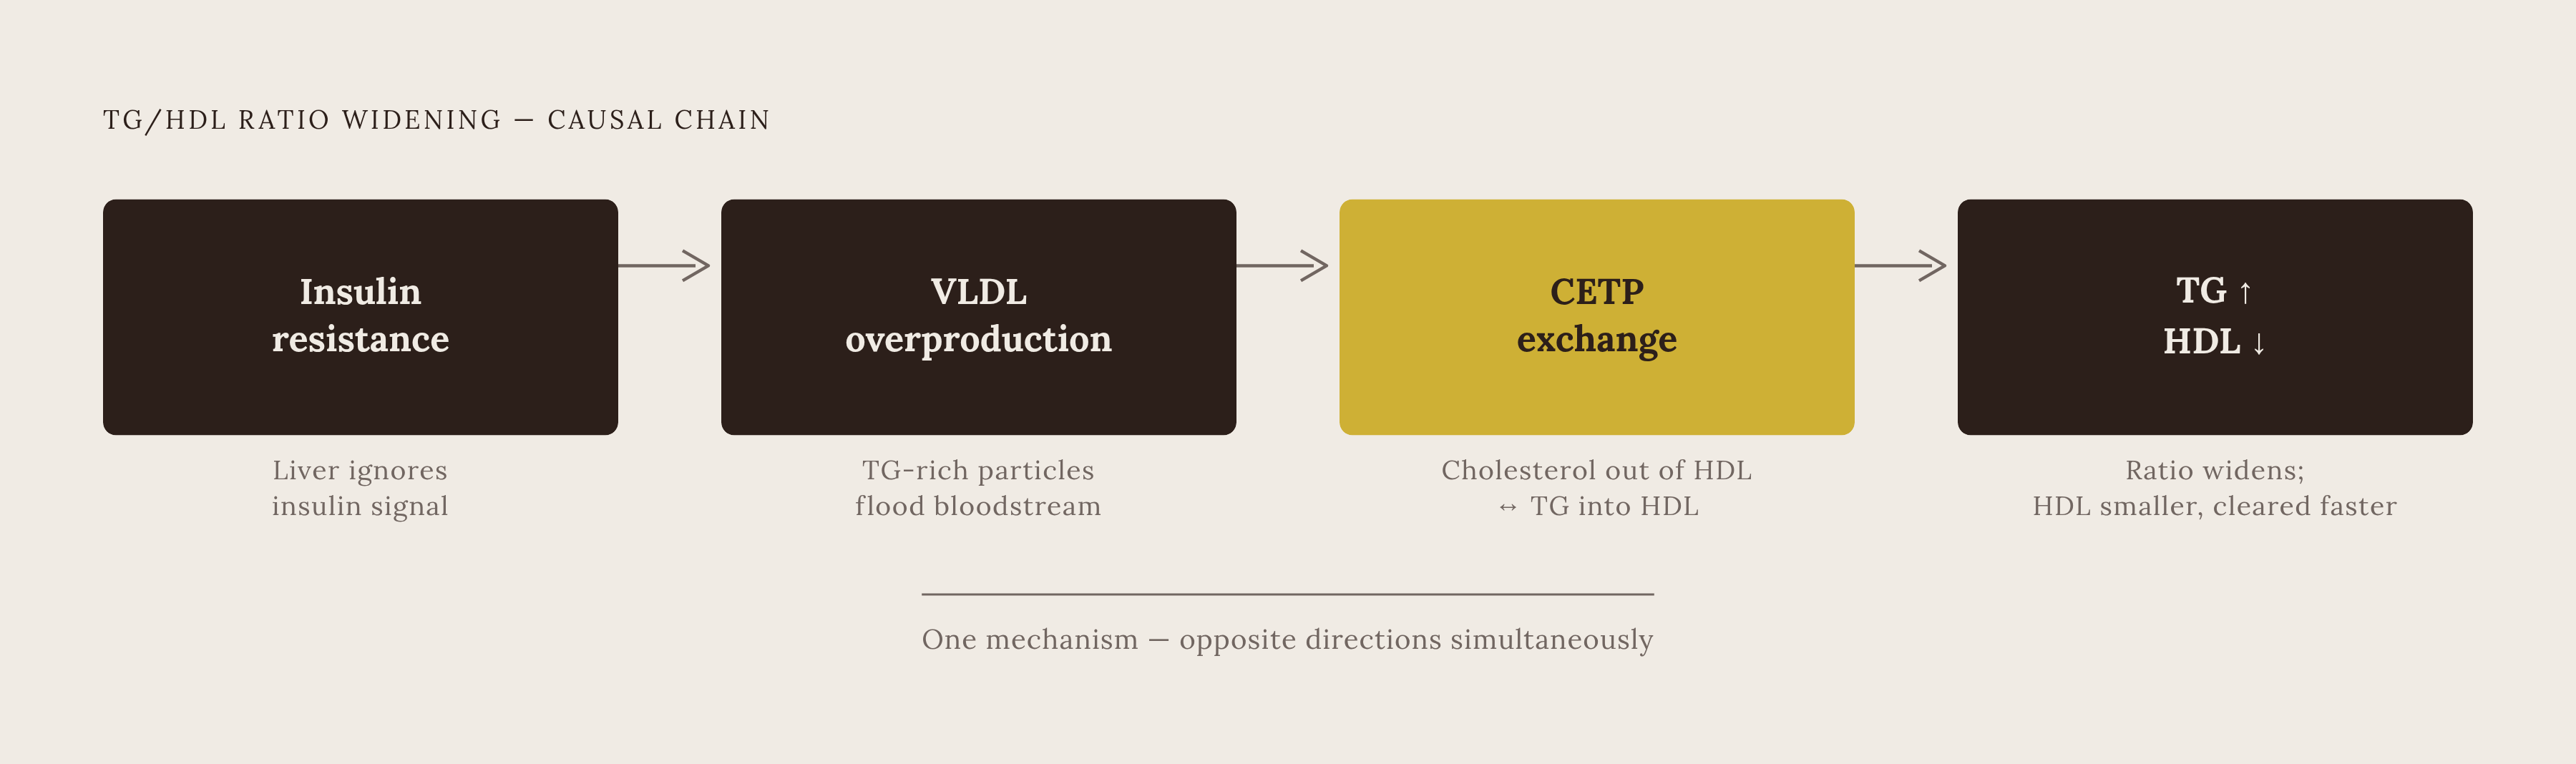
The triglyceride-to-HDL ratio climbs when insulin resistance shows up, and it climbs for a specific biological reason: triglycerides and HDL aren't two separate readings. They're two ends of the same breakdown. When cells quit responding to insulin properly, the liver loses its brakes on VLDL production. Normally, insulin tells the liver to hold onto fat and stop exporting it into the blood. A resistant liver ignores that signal and keeps pumping out triglyceride-rich VLDL particles, acting as though the body is still in a fasting, energy-starved state even when it's full.
Those extra VLDL particles don't just raise triglycerides on their own. They set off a trade inside the blood called the CETP exchange, where cholesteryl-ester transfer protein swaps cholesterol out of HDL particles for triglycerides from VLDL. That trade leaves HDL smaller, less stable, and cleared from the bloodstream faster than it should be. As VLDL rises, HDL falls, and the ratio between them widens for a traceable, mechanical reason.
This matters because a high TG/HDL ratio points to something the standard lipid panel doesn't show directly: small, dense LDL particles. These particles are more dangerous than regular LDL because they slip into artery walls more easily, oxidize there, and trigger the inflammation that builds plaque. Someone can have a perfectly unremarkable LDL-C number and still be carrying a dangerous load of these small, dense particles, and the TG/HDL ratio is one of the few signals on a routine panel that hints at their presence.
Lifestyle factors push on this same chain from different angles. Inactivity lowers the activity of an enzyme called lipoprotein lipase, or LPL, which is responsible for clearing triglycerides out of the blood. When LPL activity drops, triglycerides linger longer, and the ratio climbs. Diet works the same way from the production side: diets high in refined carbohydrates and starches push the liver to make more triglycerides while also lowering HDL, widening the gap between the two numbers even further.
What genomic evidence adds to the mechanistic case
The physiology explains how the ratio moves, and genetics backs up why it moves the way it does. Large-scale genomic research has found that the genes most strongly tied to TG/HDL levels are the same genes known to control how cells respond to insulin. That's not a coincidence of statistics.
What makes this finding harder to dismiss is where it comes from. The same pattern appeared across two separate, very large biobank studies, done in two different ancestry groups. Finding the same genetic overlap twice, in two populations that don't share much ancestry, is a strong argument that this connection is built into human metabolism generally rather than being a quirk of one dataset or one group of people.
The implication carries weight for anyone skeptical of surrogate markers: the TG/HDL ratio isn't just a clinical shortcut invented for convenience. It traces back to inherited biology. The genes behind insulin signaling and the genes behind this lipid pattern overlap, and that overlap holds up even before anyone gets a chance to eat, exercise, or sleep differently.
Thresholds, units, age, and sex
Reading the ratio correctly starts with the math, which is simple: divide triglycerides by HDL cholesterol, using numbers from the same fasting lipid panel, but the complication is the units. In the United States, both triglycerides and HDL are reported in mg/dL, and the thresholds that matter for U.S. readers come from studies using that same unit. Thresholds built on another common unit produce different numbers. Plugging a U.S. mg/dL ratio into a mmol/L-based cutoff, or the reverse, gives a meaningless answer.
In clinical literature, a ratio above 3.0 is commonly cited as a flag for significant insulin resistance and the kind of metabolic dysfunction that speeds up age-related disease. But that single number isn't the whole story. A 2025 Thai cohort study of people with type 2 diabetes found a cutoff of 2.52 that predicted high 10-year cardiovascular risk, and recommended an even lower cutoff of 2.42 for older adults. The risk threshold moves downward with age because the same ratio carries more weight the longer it's been present.
Age changes the picture even in healthy people with no diagnosis. In men, the typical TG/HDL ratio climbs substantially between early adulthood and the 50s. In women, ratios stay lower across most of life but follow that same upward drift with age. A ratio that looks fine on paper at 55 might actually represent meaningful drift from where that same person sat at 30. Reading the number without reading the trend misses the point. None of this requires a new test. Triglycerides and HDL are already sitting in a standard lipid panel. What's usually missing is the arithmetic and the context to interpret it, not the data itself. The honest way to use any threshold is as a prompt to look closer, not as a verdict. A ratio above 3.0, or one that's been climbing, says "investigate further." It doesn't say "diagnosis confirmed."
Where the ratio holds up (and where it does not)
The biggest limitation with TG/HDL is that it doesn't work the same way for everyone. The relationship between the ratio and insulin resistance is well established in some ancestry groups, but it performs poorly in Black adults. That's a real gap in the tool, not a footnote.
Research backs this up directly: studies have found a poor association between the TG/HDL ratio and insulin resistance specifically in African American adults. Meanwhile, separate studies in Korean, Iranian, and Kazakh populations have each produced their own thresholds, and those thresholds differ substantially from each other. Kazakh data point to a meaningfully lower cutoff than what Korean or Iranian research suggests. No single number travels cleanly across ethnic groups, and treating 3.0 as a universal line ignores that.
The ratio also seems to lose some of its power right where it would be most useful. A prediabetes study in India found that the median TG/HDL ratio was clearly higher in people with prediabetes than in healthy controls, which sounds like confirmation. But within that same prediabetic group, there was no correlation between HOMA-IR and the TG/HDL ratio. Prediabetes is exactly the stage where catching insulin resistance early matters most, and it's exactly where this marker seems to get fuzzier rather than sharper.
Diet introduces another wrinkle. People on low-fat, plant-based diets can see their HDL drop even while other markers of cardiovascular health improve. Someone eating that way could watch their TG/HDL ratio widen without any worsening of insulin sensitivity behind it. Trying to fix that ratio by adding saturated fat to push HDL back up would treat the wrong problem; it raises the number without addressing anything metabolic. The ratio also can't distinguish high triglycerides caused by insulin resistance from high triglycerides caused by alcohol, inherited hypertriglyceridemia, or an underactive thyroid. All three can push triglycerides up without insulin resistance driving any of it.
If fasting insulin and HOMA-IR already exist as more direct measures, the reason to lean on a proxy at all comes down to access. The answer comes down to access. Fasting insulin isn't part of routine screening, it needs careful sample handling, and it rarely gets ordered unless a clinician specifically requests it. The TG/HDL ratio needs none of that. It's sitting in a test most people have already had.
What an elevated ratio predicts at the population level
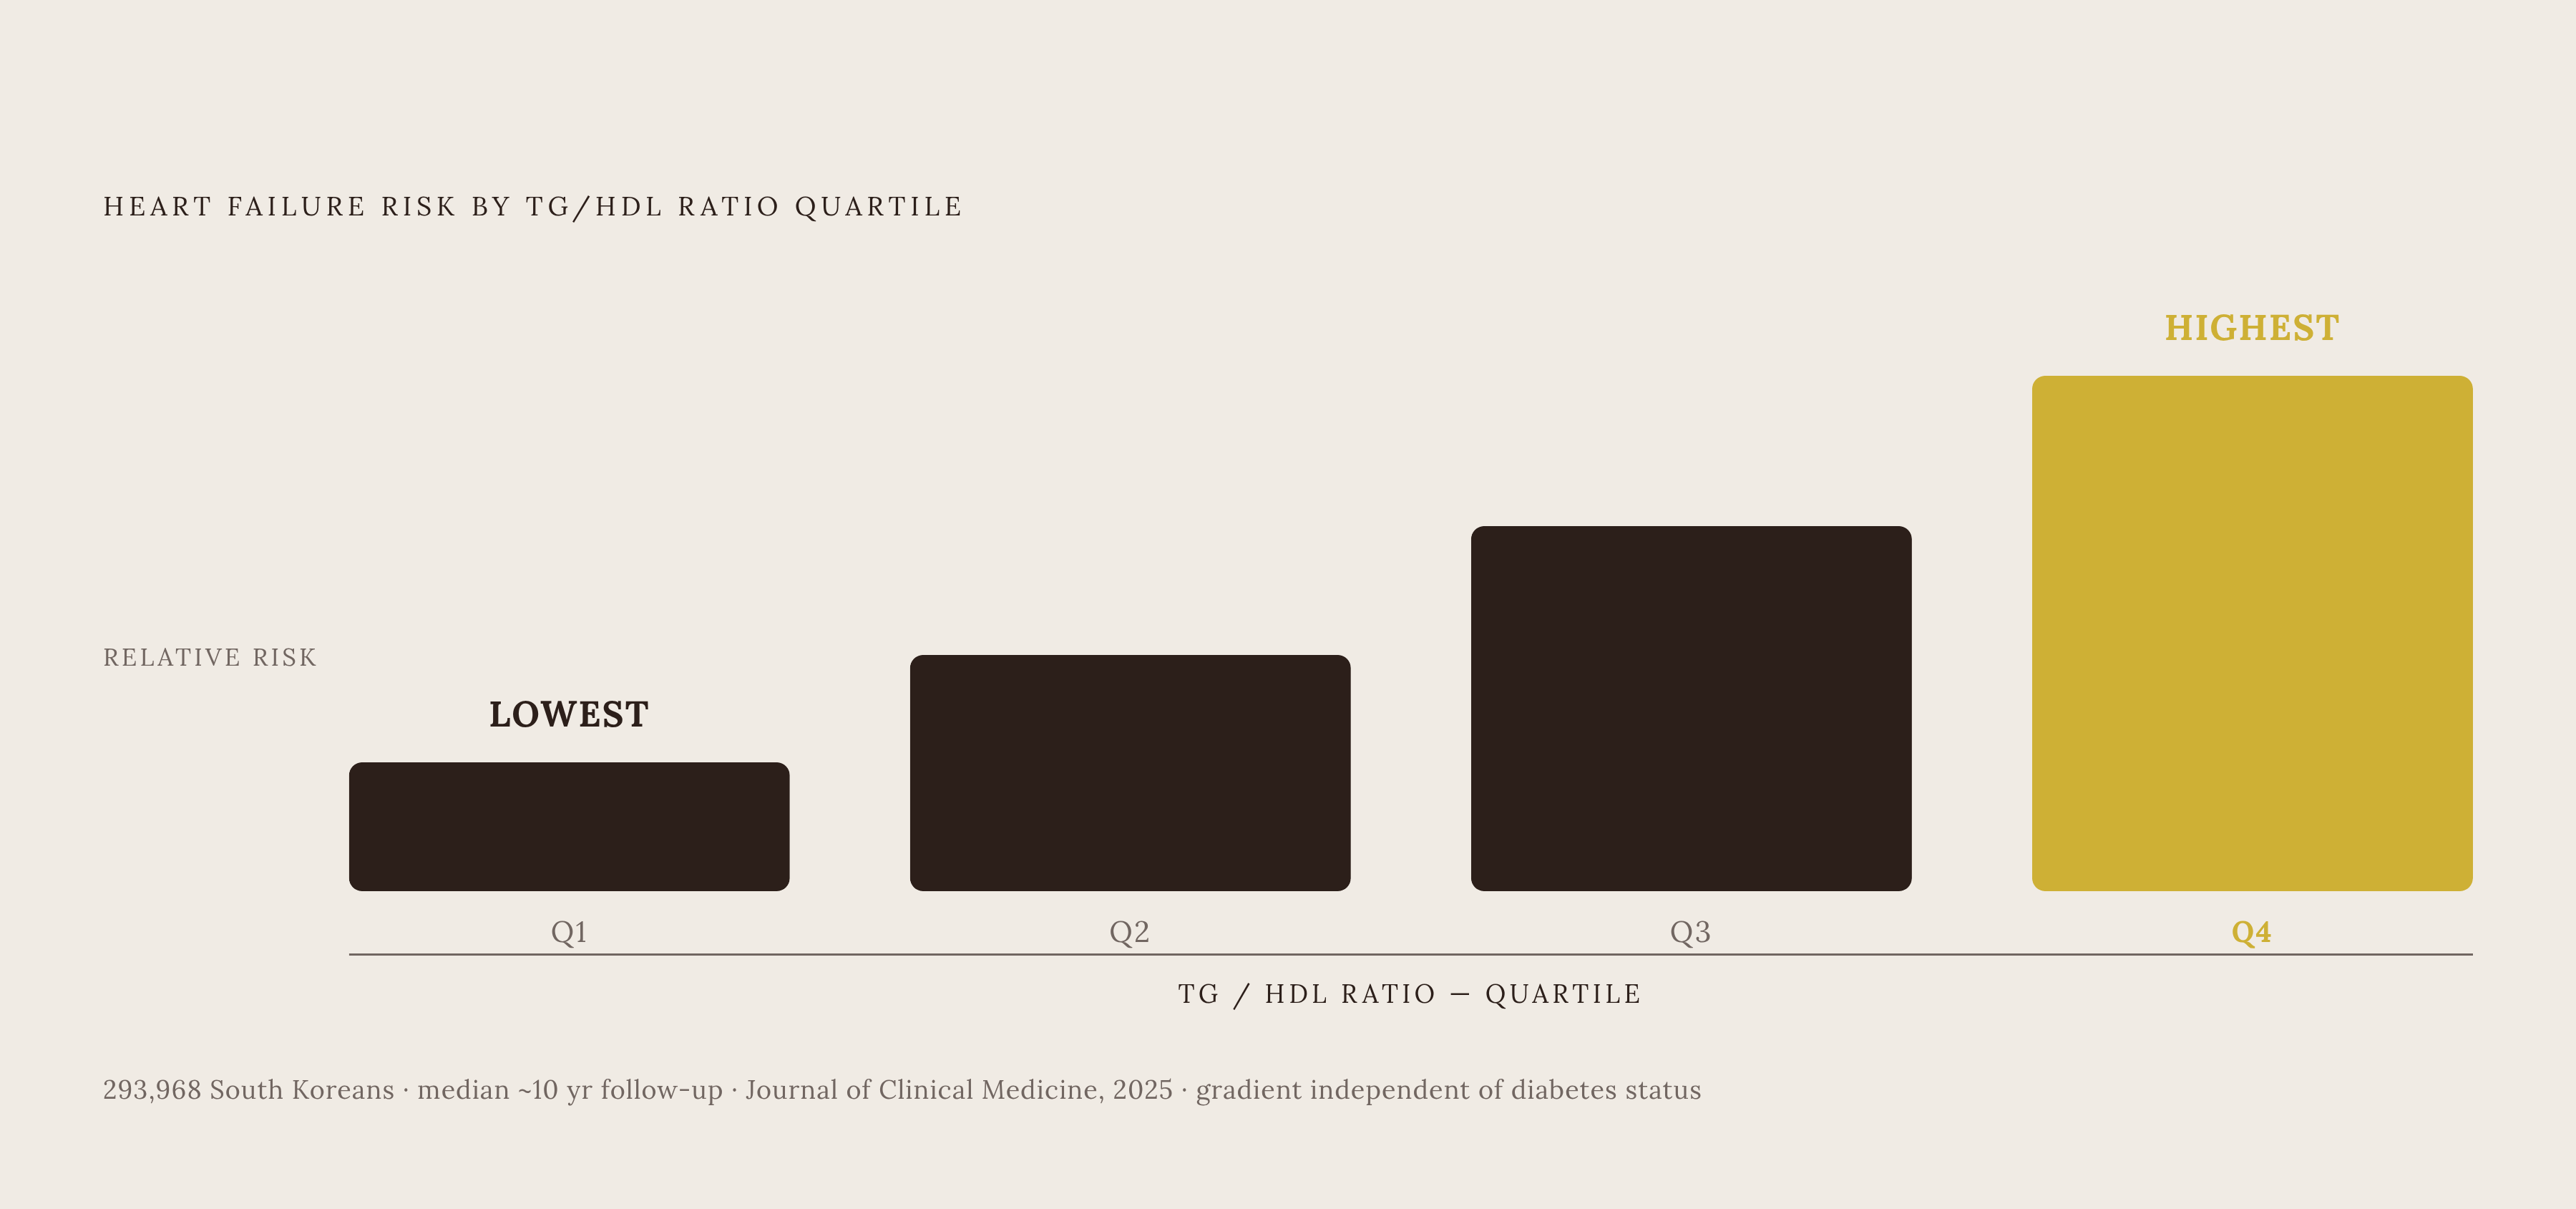
The value of this ratio isn't limited to flagging metabolic dysfunction on paper. It appears in hard outcomes, including heart failure, measured across very large groups of people tracked over time. A cohort study published in the Journal of Clinical Medicine in 2025, built on South Korean National Health Insurance data collected from 2002 to 2019, followed 293,968 people for a median of almost a decade. A meaningful share of that group developed heart failure during the study period, and the TG/HDL ratio, measured repeatedly over time, was linked to that risk independent of whether someone had diabetes. The pattern held in both diabetic and non-diabetic groups.
The data also showed a dose-response relationship: people in the highest quartile of average TG/HDL carried progressively greater heart failure risk than those in the lowest quartile, with risk climbing step by step across the quartiles in between. A clean dose-response curve like that is a stronger kind of evidence than a simple correlation, because it's the pattern researchers look for when trying to rule out confounding.
That connects back to why catching this early matters. Insulin resistance builds for years before blood sugar itself moves out of range, so someone with a rising TG/HDL ratio and a completely normal fasting glucose may already be well into a process that standard screening hasn't picked up yet. Spotting that pattern before glucose abnormalities appear is precisely the window where changing course still has the most room to work.
What to do when the ratio is elevated: a ranked response
An elevated TG/HDL ratio is a prompt to act, not a diagnosis on its own, and the evidence points toward a clear order of operations: change daily habits first, add targeted supplementation second, and only then move to deeper testing that confirms and characterizes what's actually going on. Lifestyle changes come first because they address the root drivers directly. Cutting back on refined carbohydrates and starches works especially well, since those foods are a primary trigger for the liver overproducing VLDL in the first place, and low-carbohydrate eating paired with modest calorie reduction has a solid track record for lowering triglycerides. Among dietary patterns studied for high triglycerides, the Mediterranean diet has the strongest and most consistent evidence behind it. Movement deserves equal weight here, since even small increases in physical activity meaningfully improve the LPL pathway responsible for clearing triglycerides from the blood, making exercise a genuine first-line intervention. Raising HDL by eating more saturated fat might narrow the ratio on paper, but saturated fat can raise cardiovascular risk through other pathways, so a "better" ratio achieved that way isn't actually a better outcome.
If lifestyle changes alone aren't enough, targeted supplementation is the next step, and the evidence here points specifically to omega-3 fatty acids. EPA and DHA combined, at daily doses between 2 and 4 grams, have the largest body of clinical trial evidence behind them for lowering triglycerides, with reductions in the range of 15 to 30 percent at those doses. For people with more severe or higher-risk situations, prescription icosapentaenoic acid, sold as Vascepa at 4 grams per day, serves two specific purposes under medical supervision: as an add-on to diet for severe hypertriglyceridemia at or above 500 mg/dL, and for reducing cardiovascular events in people with triglycerides at or above 150 mg/dL who are already on maximum-tolerated statin therapy and have established cardiovascular disease or diabetes with two or more additional risk factors. This is a prescription decision to make with a clinician, not something to self-start.
The third step is testing that confirms and sharpens what the ratio is only hinting at. ApoB measures the actual number of atherogenic particles in the blood, which is the thing TG/HDL implies but can't quantify directly, so an elevated ratio followed by ApoB testing shows whether small, dense LDL particles have actually built up to a risky level. Fasting insulin and HOMA-IR go a step further and confirm the insulin resistance itself directly. Someone whose doctor brushes off a high TG/HDL ratio can point out that triglycerides and HDL are recognized as independent cardiovascular risk factors on their own, regardless of what LDL-C shows. A person who understands this sequence, lifestyle changes first, supplementation if needed, confirmatory testing to sharpen the picture, puts themselves years ahead of a system that would otherwise wait for a glucose number to cross a line before taking any of this seriously.
How to find the ratio in your own lab results
Most people already have what they need to calculate this ratio sitting in an old lab report. Any standard fasting lipid panel reports both triglycerides and HDL cholesterol. Dividing triglycerides by HDL, using the mg/dL values on a U.S. report, produces the ratio directly. No extra blood draw, no extra charge, no extra appointment.
The catch is that lab reports almost never calculate this number or flag it for the patient. Someone has to pull up their own triglyceride and HDL values and do the division themselves. That's a gap in how results get delivered, not a gap in what gets measured.
Once the number is in hand, a ratio above the commonly cited 3.0 threshold, or one that's been climbing across a few years of annual panels, is a clear signal to ask for ApoB and fasting insulin testing. Those two tests add the specificity that the ratio can point toward but can't resolve by itself. Ancestry matters here too: given the weaker association found in people of African descent, that population should lean more heavily on fasting insulin and ApoB as primary signals as the main indicator.
The single most useful habit is tracking the number over time. A ratio that climbs from 1.8 to 2.6 over three years in someone who otherwise looks healthy says more than a one-time reading of 2.8 with no history behind it. That argues for pulling triglycerides and HDL off every annual panel, doing the division each time, and watching the line move. The number itself is already free. The only thing standing between a routine lipid panel and an early warning sign is whether anyone bothers to do the arithmetic and track where it's headed.
Sources
- Diagnostic Value of the Triglyceride-to-HDL Cholesterol Ratio for Assessing Insulin Resistance in Healthy Kazakh Adults
- Association Between Triglyceride/High-Density Lipoprotein Ratio and Incidence Risk of Heart Failure: A Population-Based Cohort Study - PMC
- Genome-wide discovery and integrative genomic characterization of insulin resistance loci using serum triglycerides to HDL-cholesterol ratio as a proxy
- Genome-wide discovery and integrative genomic characterization of insulin resistance loci using serum triglycerides to HDL-cholesterol ratio as a proxy
- Triglyceride to high-density lipoprotein ratio as a predictor for 10-year cardiovascular disease in individuals with diabetes in Thailand
- Frontiers
- The Association of the Triglyceride-to-HDL Cholesterol Ratio with Insulin Resistance in White European and South Asian Men and Women
- Influence of age and gender on triglycerides-to-HDL-cholesterol ratio (TG/HDL ratio) and its association with adiposity index - ScienceDirect