HOMA-IR Score Interpretation and Insulin Resistance
The test measures liver insulin response from a fasting blood draw, not full-body resistance.
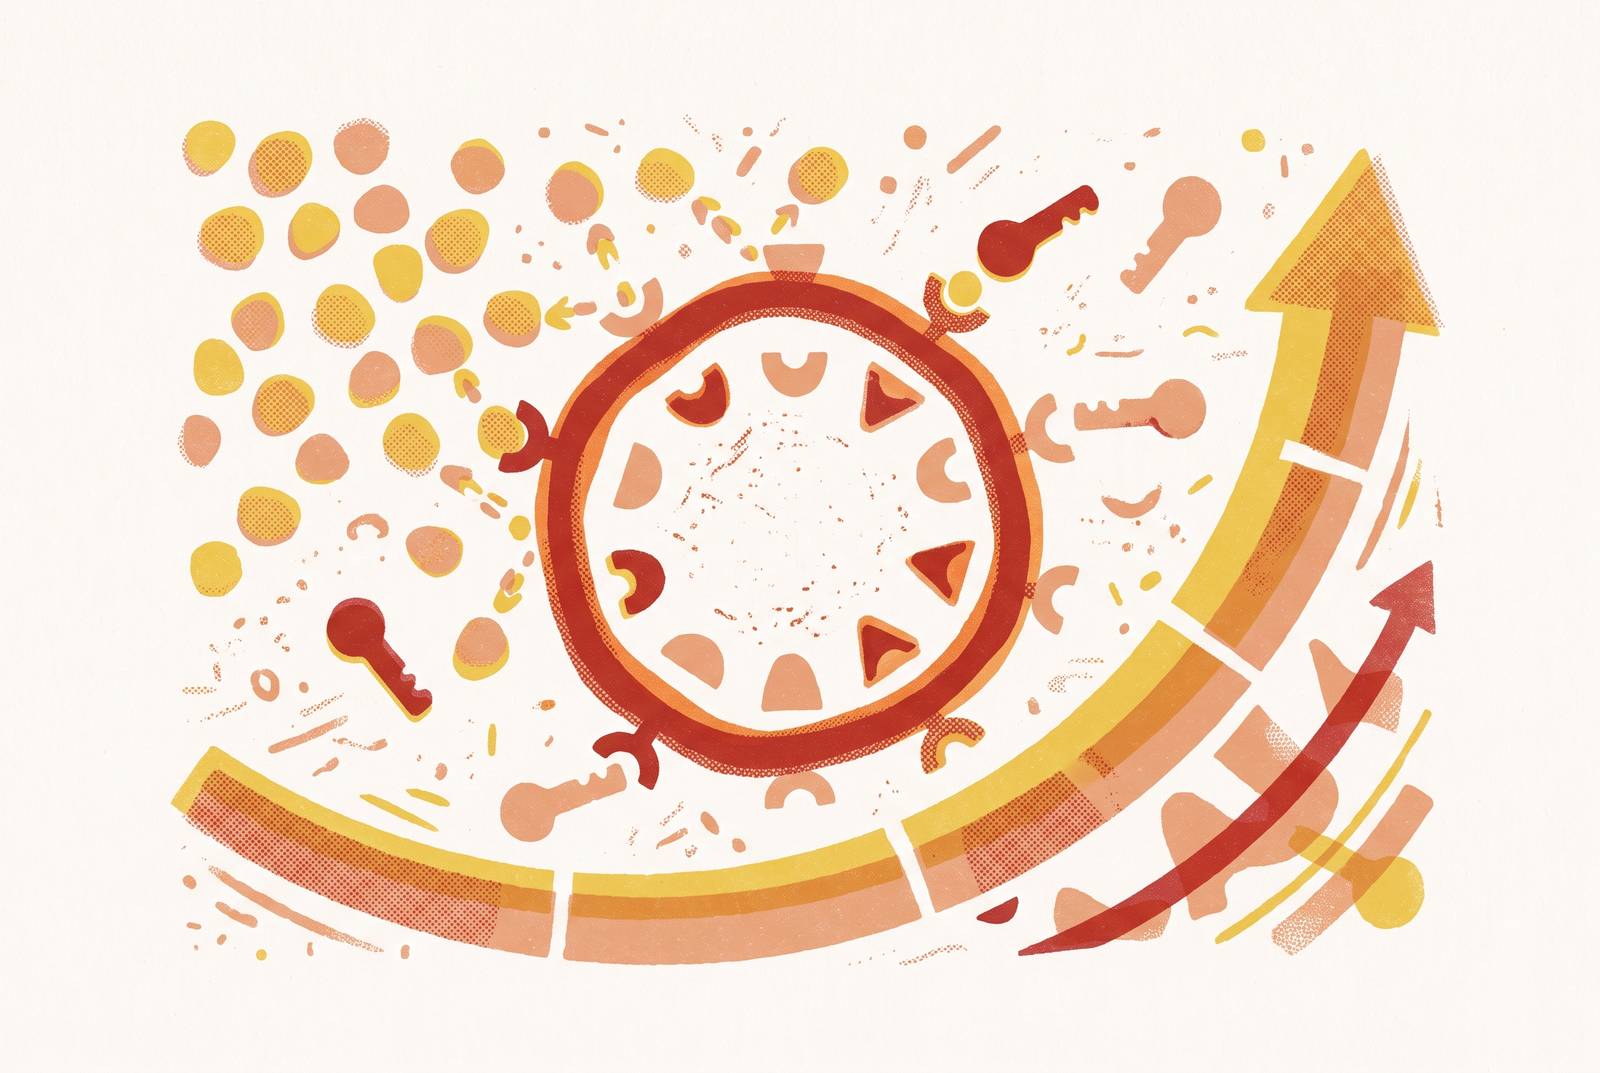
HOMA-IR estimates how well the liver responds to insulin, using two numbers from a single fasting blood draw: glucose and insulin. Before reading a score as good or bad, it helps to know what the test is actually built to detect, because that shapes everything that follows.
What HOMA-IR Calculates
Picture the liver as a thermostat for blood sugar. When it senses rising glucose, it should respond to insulin's signal and dial down its own glucose output. HOMA-IR is a mathematical snapshot of how well that thermostat is working, built from fasting insulin and fasting glucose, divided by a constant. The formula multiplies the two fasting values and divides by 405 when glucose is measured in mg/dL, or by 22.5 when glucose is measured in mmol/L. Either version produces the same underlying estimate.
That number is a proxy for hepatic insulin resistance, not a full-body readout of how every tissue handles insulin. The model assumes a specific feedback loop: the liver senses glucose, the pancreas releases insulin, and the liver's response (or lack of it) raises both numbers together. So HOMA-IR leans toward reflecting what the liver is doing rather than what's happening inside muscle or fat tissue.
Muscle tissue often develops insulin resistance before the liver does, and that kind of trouble tends to appear first as a spike in blood sugar after meals, not as a problem visible on an empty stomach. A fasting test can miss it. Catching early dysglycemia in muscle tissue usually takes a dynamic test, something that challenges the body with glucose and watches how it responds over time, like an oral glucose tolerance test or a euglycemic clamp.
The clamp is the gold standard for measuring insulin resistance directly. HOMA-IR correlates well with clamp results, but the correlation isn't perfect, and that gap matters for how the test should be used. Matthews and colleagues built the original HOMA model in 1985, and they checked it, a computer-solved mathematical calculation, against data from published physiology studies and a set of real study participants. It was never run through a clinical trial built to validate it as a diagnostic tool. It was built for population research, for tracking insulin resistance trends across large groups of people, not for pinning a diagnosis on one person in an exam room. That context shapes how a single HOMA-IR number should be read: as a screening clue, not a verdict.
Why the score is unreliable in several patient groups
HOMA-IR gives misleading results in four groups of people, so you need to know which group applies before you order it.
People already diagnosed with diabetes, or anyone on injected insulin, fall into the first group. Medication manages glucose and insulin now, so the natural feedback loop HOMA-IR depends on no longer reflects how the body regulates itself. The score at that point measures the treatment as much as the physiology.
Lean individuals or anyone with a normal BMI make up the second group, and this one surprises people. Fasting insulin can look completely normal in a lean person even when insulin resistance is quietly present, because the dysfunction only becomes visible after a glucose challenge. The fasting snapshot looks clean while the problem hides in what happens after meals.
Adults over 60 form a third group, and this one needs naming directly. Beta-cell function changes with age, and so does body composition, shifting what counts as a normal score for someone in their 60s or 70s compared to someone in their 30s. Cutoffs built from younger, mixed-age populations don't map cleanly onto older adults.
People in acute illness or under physical stress make up the fourth group. Cortisol and other stress hormones push both glucose and insulin up temporarily, so a HOMA-IR score drawn during a cold, a flare-up, or a stressful week measures that event, not a person's baseline metabolic state.
Knowing which of these four groups applies is itself useful information. It tells someone whether HOMA-IR is the right test to ask for at all, or whether a clinician should reach for something else. The test earns its keep in a specific population: metabolically at-risk adults who carry extra weight, a larger waist circumference, abnormal cholesterol or triglyceride patterns, or early signs of impaired glucose tolerance, who haven't yet been diagnosed with diabetes and aren't currently sick or under acute stress. For that group, HOMA-IR is doing exactly the job it was built for.
The cutoff problem: same score, different meanings at different labs
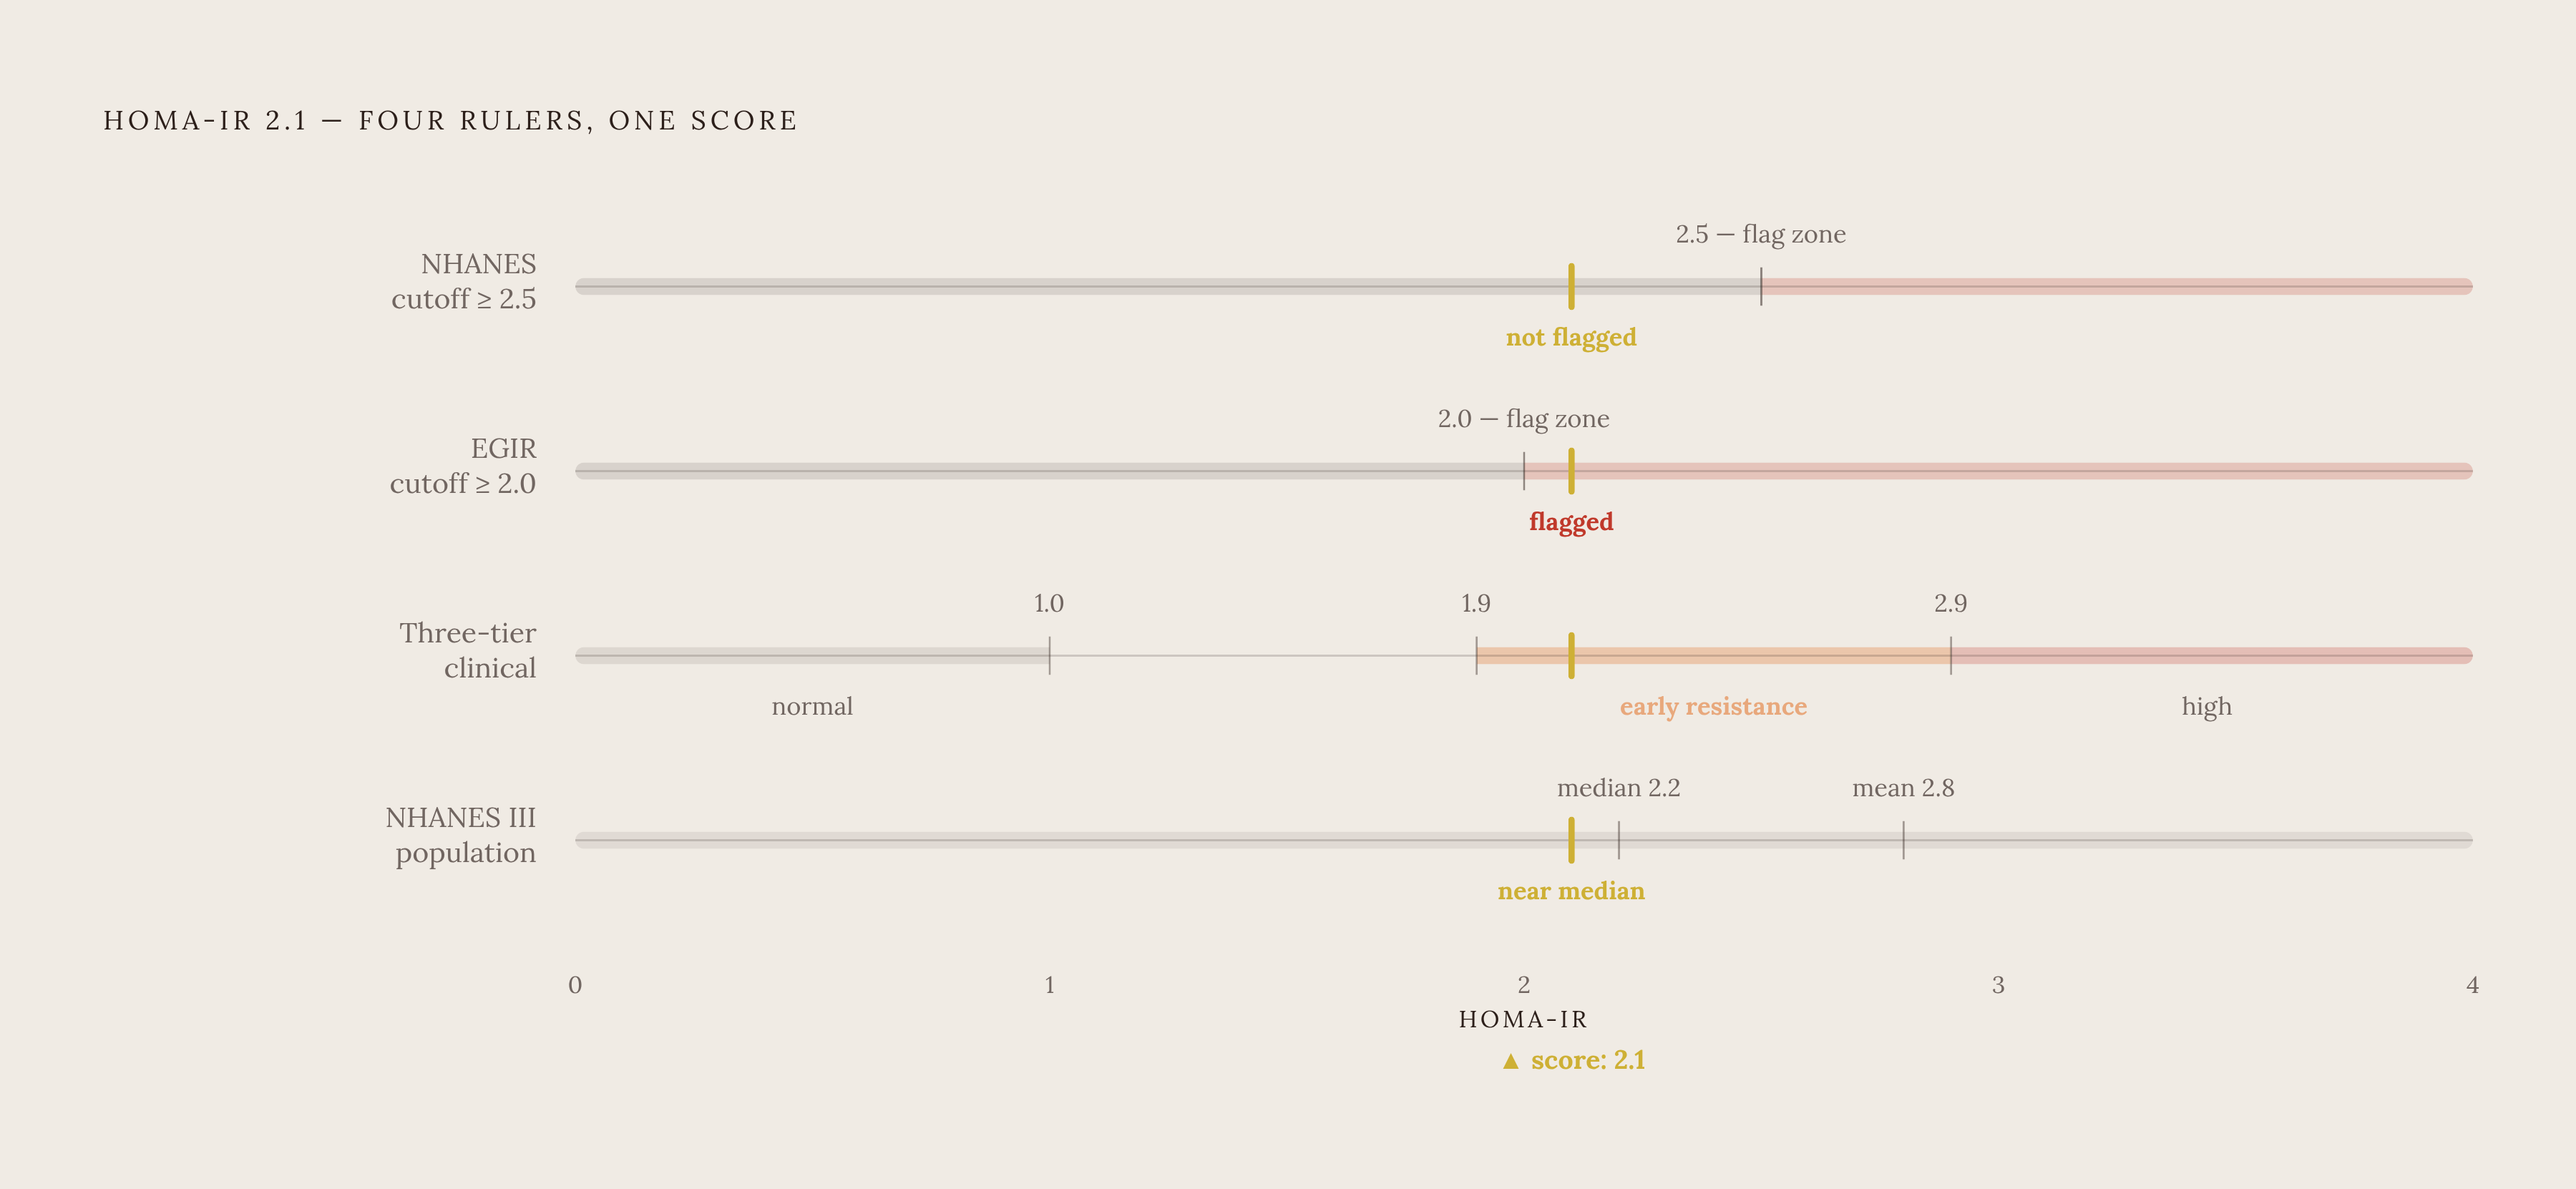
There's no single number everyone agrees means "insulin resistant. Take a HOMA-IR of 2.1. Running that same score through a few different frameworks produces a different story each time.
U.S. clinical and research settings often flag insulin resistance with a cutoff between 2.0 and 3.0. NHANES, the large government health survey that many U.S. reference ranges are built from, sets its cutoff at 2.5 or higher. The European Group for the Study of Insulin Resistance uses a lower bar, 2.0 or higher. Under NHANES criteria, a 2.1 falls just under the line. Under the European cutoff, that same 2.1 crosses it.
A separate three-tier framework used widely in clinical practice reads the number differently still: below 1.0 suggests normal insulin sensitivity, above 1.9 suggests early insulin resistance where lifestyle change is appropriate, and above 2.9 signals significant insulin resistance that calls for further diagnostic workup. Under this scheme, 2.1 lands solidly in the early insulin resistance zone.
Context from NHANES III adds another layer. Among U.S. adults without diabetes, the median HOMA-IR is 2.2, and the mean is 2.8. A score of 2.1, which looks elevated against a research cutoff of 2.0, actually sits close to the middle of how the real population scores. The number needs a population to compare against, not just a single cutoff pulled from a different context.
Ethnicity changes the picture further. Asian populations tend to develop metabolic risk, particularly visceral fat relative to BMI, when HOMA-IR values are still lower than the cutoffs built from largely U.S. or European data. Cutoffs for Asian populations commonly run between 1.4 and 2.5. Applying a U.S.-derived threshold to an Asian patient can produce a false sense of reassurance, missing resistance that a population-appropriate cutoff would catch.
Then there's the lab itself. Insulin assays aren't standardized across laboratories, so two people with the exact same true insulin level can get different numbers back depending on which lab ran the sample. So if you compare one person's score against another's, or against a cutoff built from a different lab's assay, the comparison is close to meaningless. Tracking a score's direction over time within the same lab tells a far more reliable story than comparing a single result against a generic threshold.
A newer version of the model, HOMA2, can use C-peptide instead of insulin and partially corrects for assay variability. It's available through a downloadable calculator built by researchers at the University of Oxford, and it helps explain why a clinician's number might not match what a consumer tool reports for the same blood draw.
What an elevated score predicts
An elevated HOMA-IR isn't only a flag for future diabetes. It independently predicts cardiovascular trouble and accelerated aging, so a fasting glucose test alone can miss that.
Insulin resistance can sit undetected for a decade or longer before glucose numbers move enough to draw attention. That window is the real danger: insulin resistance is an independent risk factor for cardiovascular disease, high blood pressure, and type 2 diabetes, not just a symptom that trails behind them. A meta-analysis pooling a large number of studies and participants found that HOMA-IR carries a higher relative risk for coronary heart disease than elevated fasting glucose does on its own. If your glucose reads normal but your insulin runs high, you're carrying more cardiovascular risk than the glucose number alone would suggest.
Age changes what the score connects to as well. Higher HOMA-IR shows a significant association with frailty in elderly populations, but that association doesn't appear consistently in middle-aged groups. That makes HOMA-IR a particularly useful biomarker for people in and past midlife who are thinking about long-term function, not just disease prevention.
The score also reaches into hormonal territory. HOMA-IR is positively associated with serum free triiodothyronine, or FT3, a thyroid hormone. If you deal with low energy, stubborn weight, or shifting body composition, HOMA-IR may be one piece of a wider hormonal pattern.
Triglycerides sharpen the picture further. A borderline HOMA-IR paired with elevated triglycerides reinforces both signals at once. Normal blood sugar combined with high insulin already meets the definition of insulin resistance on its own, and a high triglyceride reading backs that finding up.
Reading your score range
A HOMA-IR result isn't pass or fail. Each range calls for a different response, and treating the whole test as binary throws away most of the information it carries.
Below 1.0 suggests normal insulin sensitivity. No intervention is called for here, and the real value of a result in this range is setting a baseline to compare against later, not confirming that nothing will ever change.
Between 1.0 and 1.9 sits an impaired sensitivity zone. Most criteria wouldn't call this range pathological, but it's a genuine window for proactive change before the trend worsens. A score here reads as an opening to act, not a diagnosis to worry over.
Above 1.9, the picture shifts to early insulin resistance, and lifestyle changes become appropriate at this point. Diet quality, activity patterns, and sleep all deserve a closer look, and pairing the result with fasting lipids, HbA1c, or a waist circumference trend adds useful context.
Above 2.9 marks significant insulin resistance, and this range calls for a clinician's evaluation. Additional testing, an oral glucose tolerance test or HbA1c, can help assess for prediabetes or early type 2 diabetes, and at this stage you may need to talk about medication.
A handful of companion markers sharpen the whole picture: HbA1c, which reflects average blood sugar over roughly three months; fasting triglycerides, which track with insulin resistance and carry independent weight of their own; waist circumference or waist-to-height ratio, since visceral fat drives hepatic insulin resistance directly; and fasting glucose itself. All four are standard parts of a routine metabolic panel, not specialty add-ons.
No validated treatment algorithm uses a HOMA-IR number as the single trigger for a clinical decision. Clinical judgment still leads. HOMA-IR works as supporting evidence that sharpens a clinician's read on a person's metabolic picture, not as a stand-alone diagnosis.
What improves HOMA-IR
Lifestyle change is the first-line response to early insulin resistance, and the research points toward specific combinations.
High intensity interval training or resistance training, paired with a Mediterranean or plant-based diet, produces the strongest improvements in HOMA-IR that the research has seen. In practice, that looks like two to three training sessions a week alongside a diet built around fiber, whole grains, fruits, vegetables, and unsaturated fats.
A 2025 network meta-analysis compared nine different exercise approaches. Cycling produced the strongest improvement in fasting glucose specifically. Resistance training showed the strongest effect on insulin sensitivity. A combined program of resistance training and running ranked highest for HOMA-IR improvement overall, but the study didn't find statistically significant differences separating the intervention groups from one another.
Diet quality matters alongside exercise. The PREDIMED-Plus trial, published in 2025, found that a calorie-reduced Mediterranean diet combined with moderate activity and professional support meaningfully lowered type 2 diabetes risk in overweight or obese adults with metabolic syndrome, compared against a standard, non-calorie-restricted Mediterranean diet. Both the type of diet and its calorie context shaped the outcome.
The Diabetes Prevention Program, an earlier and widely cited trial, showed that structured lifestyle change substantially slowed diabetes progression in people already heading that direction. That result makes a broader point: stepping in at the insulin-resistant stage, before glucose numbers fully climb, changes where someone's health ends up years later.
Weight loss in the range of 5 to 10 percent of body weight can meaningfully improve insulin sensitivity, and that range is reachable through diet changes alone, without resorting to extreme restriction.
A 2025 analysis of the Framingham Offspring Study added a mechanistic layer to all of this. Researchers ran an epigenome-wide analysis on non-diabetic adults, and they found 35 DNA methylation sites linked to HOMA-IR, with 13 of those sites tied significantly to dietary factors. That finding gives the diet-insulin resistance connection a biological mechanism, not just a correlation observed across study populations.
Getting the test and reading the costs
A meaningful HOMA-IR result needs two specific markers pulled from one fasting blood draw: fasting insulin and fasting glucose. Both have to come from the same draw, after a fasting window, or the math behind the calculation falls apart. Ordering glucose without insulin, or insulin without glucose, produces nothing usable.
The price that shows up on a lab's website rarely tells the whole story. Phlebotomy fees, physician review fees, and processing charges often sit outside the headline price for the two tests themselves, and they can add up to more than the tests cost on their own. If you compare options across labs or testing services, ask what's included before you assume the sticker price is the total cost.
Pairing the HOMA-IR inputs with a broader metabolic panel gets more value out of a single blood draw. HbA1c, a fasting lipid panel, and a waist circumference measurement all add context that a HOMA-IR number alone can't provide, and most of them come from markers already included in routine panels.
Sources
- Updated Review of HOMA-IR (Homeostatic Model Assessment for Insulin Resistance)
- Estimate of the HOMA-IR Cut-off Value for Identifying Subjects at Risk of Insulin Resistance Using a Machine Learning Approach - PMC
- Optimal Homeostasis Model Assessment of Insulin Resistance (HOMA-IR) Cut-Offs: A Cross-Sectional Study in the Czech Population - PMC
- Insulin Resistance and Risk of Incident Cardiovascular Events in Adults without Diabetes: Meta-Analysis
- Association between HOMA-IR and Frailty among U.S. Middle-aged and Elderly Population
- Limitations of insulin resistance assessment in polycystic ovary syndrome
- Limitations of fasting indices in the measurement of insulin sensitivity in Afro-Caribbean adults
- Optimal Cut-Offs of Homeostasis Model Assessment of Insulin Resistance (HOMA-IR) to Identify Dysglycemia and Type 2 Diabetes Mellitus: A 15-Year Prospective Study in Chinese