Complete Blood Count Interpretation for Non-Clinicians
Learn which CBC numbers demand attention and how to interpret them before calling your doctor.
Complete Blood Count Interpretation for Non-Clinicians
Why you now see a CBC without a doctor explaining it
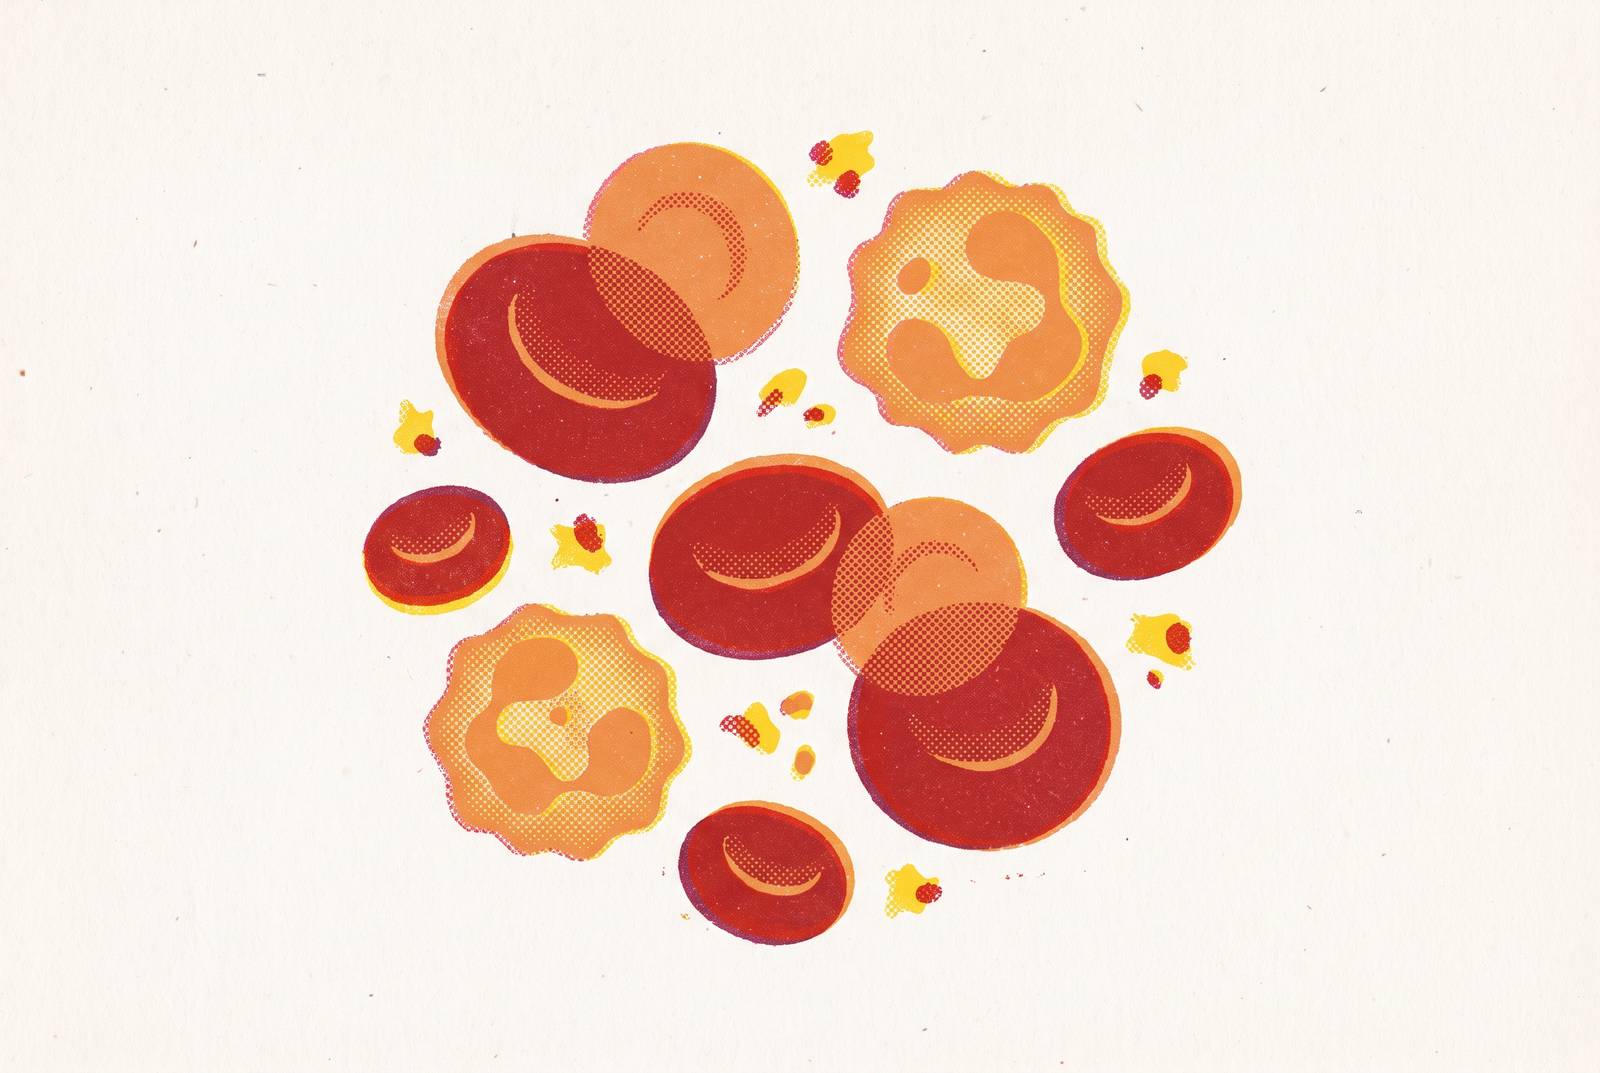
A complete blood count measures three cell populations: red blood cells, which carry oxygen, white blood cells, which handle immune defense, and platelets, which manage clotting, along with a set of indices that describe the size, concentration, and variation within those populations. Doctors order it for routine checkups, before surgery, or when something feels off (fatigue, bruising that won't explain itself, weight loss with no clear cause). Increasingly, though, people order it themselves, with no referral and no clinician standing by to walk through what the numbers mean.
That shift changes how people encounter results before a clinician adds any context. Patient portals now hand people their results the moment they're processed, and the software behind those portals flags anything outside the reference range in red, regardless of whether it means anything. At one major institution, roughly 1,800 CBCs get run every single day, and 10% to 20% of them come back flagged as abnormal. Most of those flags aren't clinically significant. That gap, between "outside the range" and "something is actually wrong," is the whole reason this article exists.
So here's the plan: work through each major marker in plain language, explain what pushes it up or down, and separate the noise from the flags that genuinely deserve a phone call. None of this replaces a clinician reading the full picture. What it does is give a reader enough grounding to ask a sharper question at the next appointment instead of just staring at a red number and guessing. Getting this test run without a doctor's involvement has gotten easier and cheaper over the past several years, which is exactly why so many people now find themselves looking at a CBC with no one there to translate it. The CBC is one of the most frequently ordered laboratory tests in clinical practice: a single tube of blood, returned as 15–20 data points
How to read a CBC report before looking at any individual number
Before touching a single value, it helps to know that the "normal range" printed next to each number isn't a fixed biological law. Each lab sets its own reference range based on its own equipment, calibration, and the population it draws from, and those ranges shift again by age, sex, and even altitude. One comprehensive review from January 2025 pointed out that reference ranges published by large lab companies mostly come from Western or Asian population samples, which don't necessarily generalize to everyone getting tested. That's a real source of misclassification, not a footnote.
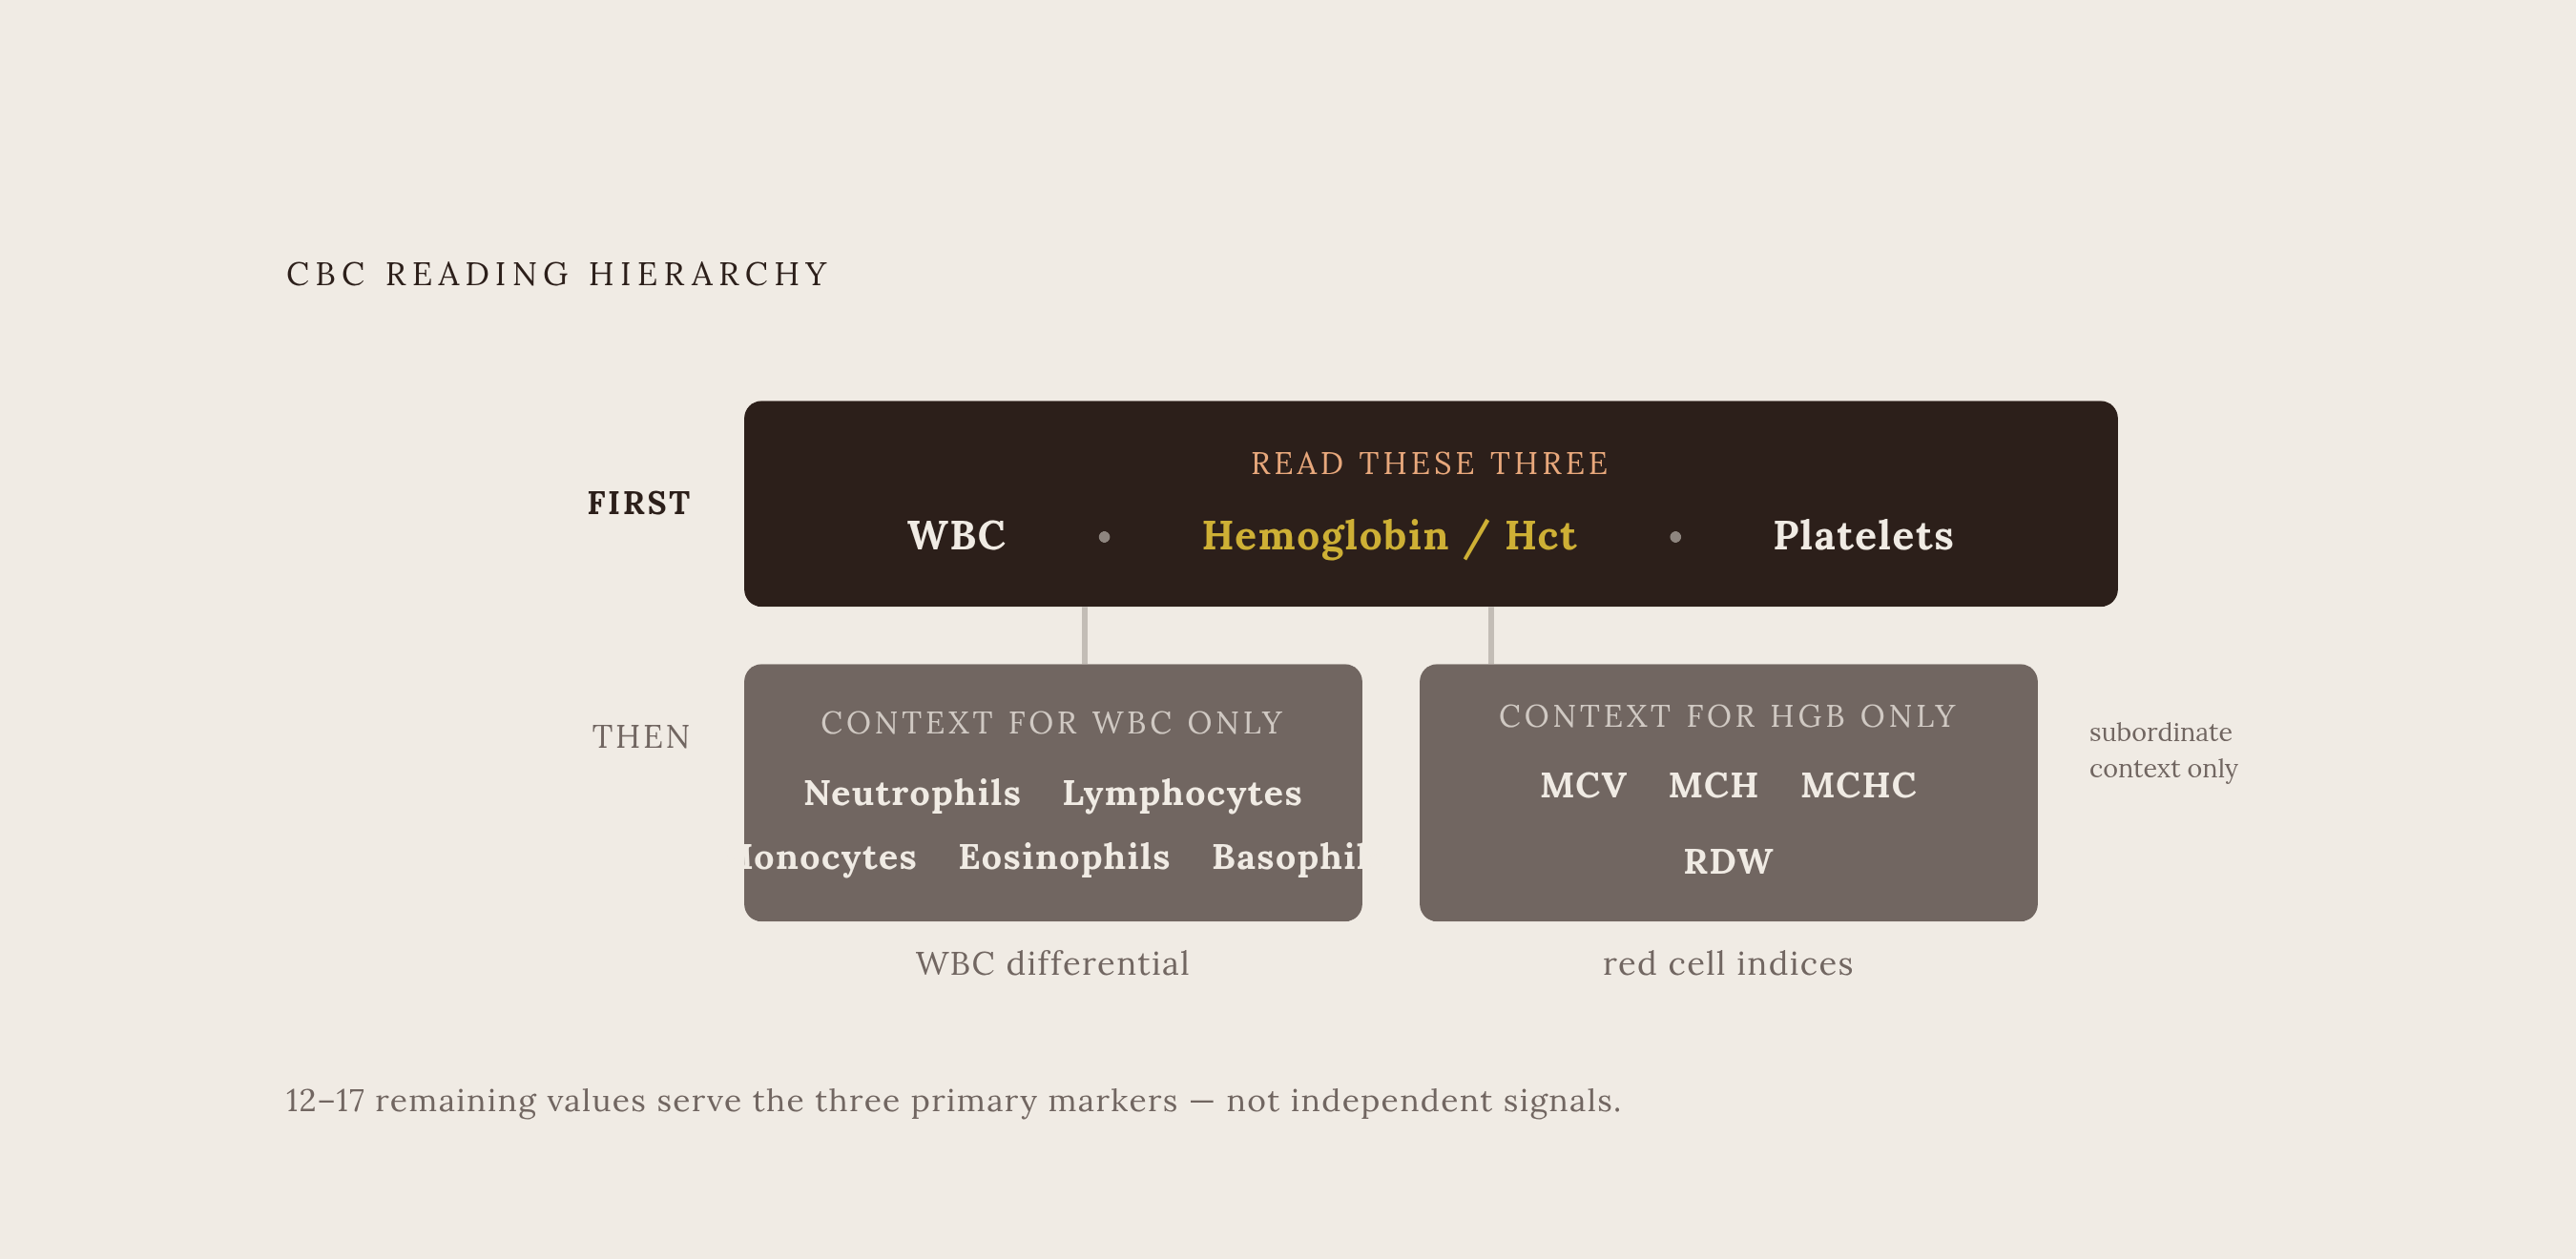
Given that 15 to 20 numbers are competing for attention, where should a reader's eye actually land first? According to the Blood Project's clinician guide, three numbers deserve the most attention: white blood cell count, hemoglobin and hematocrit, and platelet count. Everything else on the report exists to give those three context. That's a useful filter, because it means a reader doesn't need to hold 20 numbers in their head at once, just three, with the rest waiting in reserve for when one of the big three looks off.
A CBC report generates 15–20 data points that most people see without any context for which ones to act on and which to ignore. A CBC with differential breaks the total WBC into its subtypes (neutrophils, lymphocytes, monocytes, eosinophils, and basophils), which becomes important specifically when the total WBC is abnormal or when symptoms point toward something immune-related. If a report doesn't include a differential, it usually means nothing unusual was flagged in the first place.
Treat a single result as a snapshot, not a verdict. A mildly abnormal value that normalizes on the next draw is almost always noise. A value that keeps drifting in the same direction across multiple draws is a signal that should be taken seriously. In certain cases, the automated analyzer itself can misfire, miscounting or misclassifying cells, which is why a clinician will sometimes order a peripheral blood smear, a manual, human look at the actual cells under a microscope, when a result looks unexpected or contradicts the rest of the picture. Think of the report less as a verdict and more as the opening question in a conversation still to be had.
Hemoglobin and hematocrit: the numbers that tell you about anemia
Hemoglobin is the protein packed inside red blood cells that actually carries oxygen, and its concentration in the blood determines how much oxygen gets delivered to tissue, full stop. Hematocrit measures something related but distinct: the percentage of total blood volume made up of red cells. Hematocrit can climb with dehydration or altitude training, creating the appearance of a higher red cell mass than actually exists, so a high hematocrit alone isn't automatically a red flag.
The typical reference ranges, per a comprehensive January 2025 guide, run 13.8 to 17.2 g/dL for hemoglobin in men and 12.1 to 15.1 g/dL in women, with hematocrit running 40.7% to 50.3% in men and 36.1% to 44.3% in women. Low values on either measure point toward anemia, in which the blood isn't delivering enough oxygen, which shows up as fatigue, shortness of breath, pale skin, and in more severe cases, trouble concentrating. High values can mean polycythemia, an excess of red cells, though far more often they simply reflect dehydration at the time of the draw. Context does the heavy lifting here.
What actually drives hemoglobin down? Iron deficiency tops the list, followed by low B12 or folate, chronic disease, bone marrow suppression from chemotherapy or radiation, kidney failure, and straightforward blood loss. That's a wide net, which is exactly why a low hemoglobin reading on its own tells a reader that something is happening, without telling them what.
The red blood cell count itself, listed separately on most reports, carries less weight than people assume. A slightly abnormal RBC count when hemoglobin and hematocrit both sit comfortably in range is generally not something to lose sleep over. Once hemoglobin comes back genuinely low, the next question isn't whether anemia exists, it's what kind. That's where the red cell indices come in. RBC reference ranges for context are 4.7–6.1 million cells/mcL for males and 4.2–5.4 million cells/mcL for females, per Rupa Health.
MCV, MCH, MCHC, and RDW: the indices that explain why hemoglobin is low
The principle to hold onto before looking at any of these numbers is that they are not standalone findings, they are context for hemoglobin, and a flagged MCV when hemoglobin is normal is almost always noise. They exist to explain a low hemoglobin, not to be worried about independently. A flagged MCV sitting next to a perfectly normal hemoglobin is, in the overwhelming majority of cases, background noise and nothing more.
MCV, Mean Corpuscular Volume, measures the average size of a single red blood cell, with a normal range of 80 to 95 fL. When it drops below 80, the cells are running small (microcytic), which usually points toward iron deficiency or thalassemia. When it climbs above the range, the cells are running large (macrocytic), which usually points toward low B12 or folate. Both nutrients are required for DNA synthesis during red cell production, so without enough of either, cells keep growing but stop dividing on schedule, leaving them oversized. And if MCV sits right in the normal range while hemoglobin is low? That pattern suggests anemia of chronic disease, acute blood loss, or an early-stage deficiency that hasn't yet changed cell size.
MCH, the average weight of hemoglobin packed into one red cell, runs 27 to 31 pg in a normal range, and it tends to track MCV closely: smaller cells simply have less room to carry hemoglobin. MCHC measures something slightly different, how concentrated that hemoglobin is inside the average cell, with a normal range of 32 to 36 g/dL. It physically cannot climb much past 37 g/dL, because a red blood cell can only hold so much hemoglobin before running out of room. MCHC helps distinguish between anemia types in specific cases, but it's rarely the number a reader needs to act on by itself.
RDW, Red Cell Distribution Width, measures how much red blood cell sizes vary from one another, with a normal range of 11 to 15%. A high RDW means the cells circulating in the blood differ significantly in size, a pattern called anisocytosis. This turns out to be genuinely useful for telling anemia types apart: iron deficiency tends to produce a high RDW early on, since new small cells and older normal-sized cells are mixing together, while thalassemia typically produces a low RDW, since the cells stay uniformly small. RDW also carries a second life beyond anemia classification, one that matters even when hemoglobin looks perfectly normal, and that broader relevance gets picked up again later.
Don't open this section of the report until hemoglobin has already come back abnormal. From there, MCV is the first fork in the road (small, large, or normal-sized), and RDW sharpens the direction from there.
White blood cell count and the differential: what each subtype is telling you
White blood cells are the immune system's active-duty force. They detect and respond to infection, inflammation, and anything foreign in the body, and they're manufactured in bone marrow before circulating briefly through the blood on their way to tissue, where the actual work happens. The typical reference range runs 4,500 to 10,000 cells/mcL, though some clinically reviewed sources put the upper bound closer to 11,000, so it's worth checking the specific range printed on a given lab's report rather than assuming.
A high count, leukocytosis, most often reflects the body responding to infection, and bacterial infections tend to push the number higher than viral ones do. Inflammation, certain medications, parasitic infections, and bone tumors can all drive it up too, and less commonly, leukemia. A low count, leukopenia, raises infection risk and can stem from viral infections (some of which suppress the marrow directly), certain medications, autoimmune conditions, or a bone marrow disorder. A mild, temporary rise in WBC from stress, exercise, pain, or a minor illness isn't genuinely worth losing sleep over. The Blood Project's guide is explicit that these transient bumps aren't clinically significant.
When the total count is abnormal, or symptoms suggest something beyond a routine cold, the differential breaks that total into five subtypes. Neutrophils are the first responders to bacterial infection and typically make up the largest share of white cells in most adults; they rise with bacterial infection and physical stress, and drop with certain viral illnesses or drug reactions. Lymphocytes drive the adaptive immune response, fighting viruses and producing antibodies, so they climb during viral infections, while a low count can signal immune suppression. Monocytes clean up after infection and inflammation resolve, and elevated levels can accompany chronic infections or certain blood conditions. Eosinophils rise with allergic reactions and parasitic infections; mild elevations are common and usually harmless, though a sharp rise deserves a closer look. Basophils are the rarest subtype and rise in specific allergic or inflammatory conditions, but they're rarely the main signal in any diagnostic picture.
There's also the neutrophil-to-lymphocyte ratio, not always printed automatically but easy enough to calculate from the differential, which has been linked to broader health outcomes worth returning to later. But how much of this should a reader actually try to interpret alone? The Blood Project's guide is direct on this point: differential interpretation belongs to the clinician, not the patient. Still, understanding the broad categories, who does what, means a reader can ask a sharper question instead of just repeating back a scary-looking word from the report. The differential earns its keep specifically when the total WBC is abnormal or symptoms point somewhere real; a single mild elevation with no symptoms attached is, more often than not, not worth acting on.
Platelet count: the clotting number and the thresholds that matter
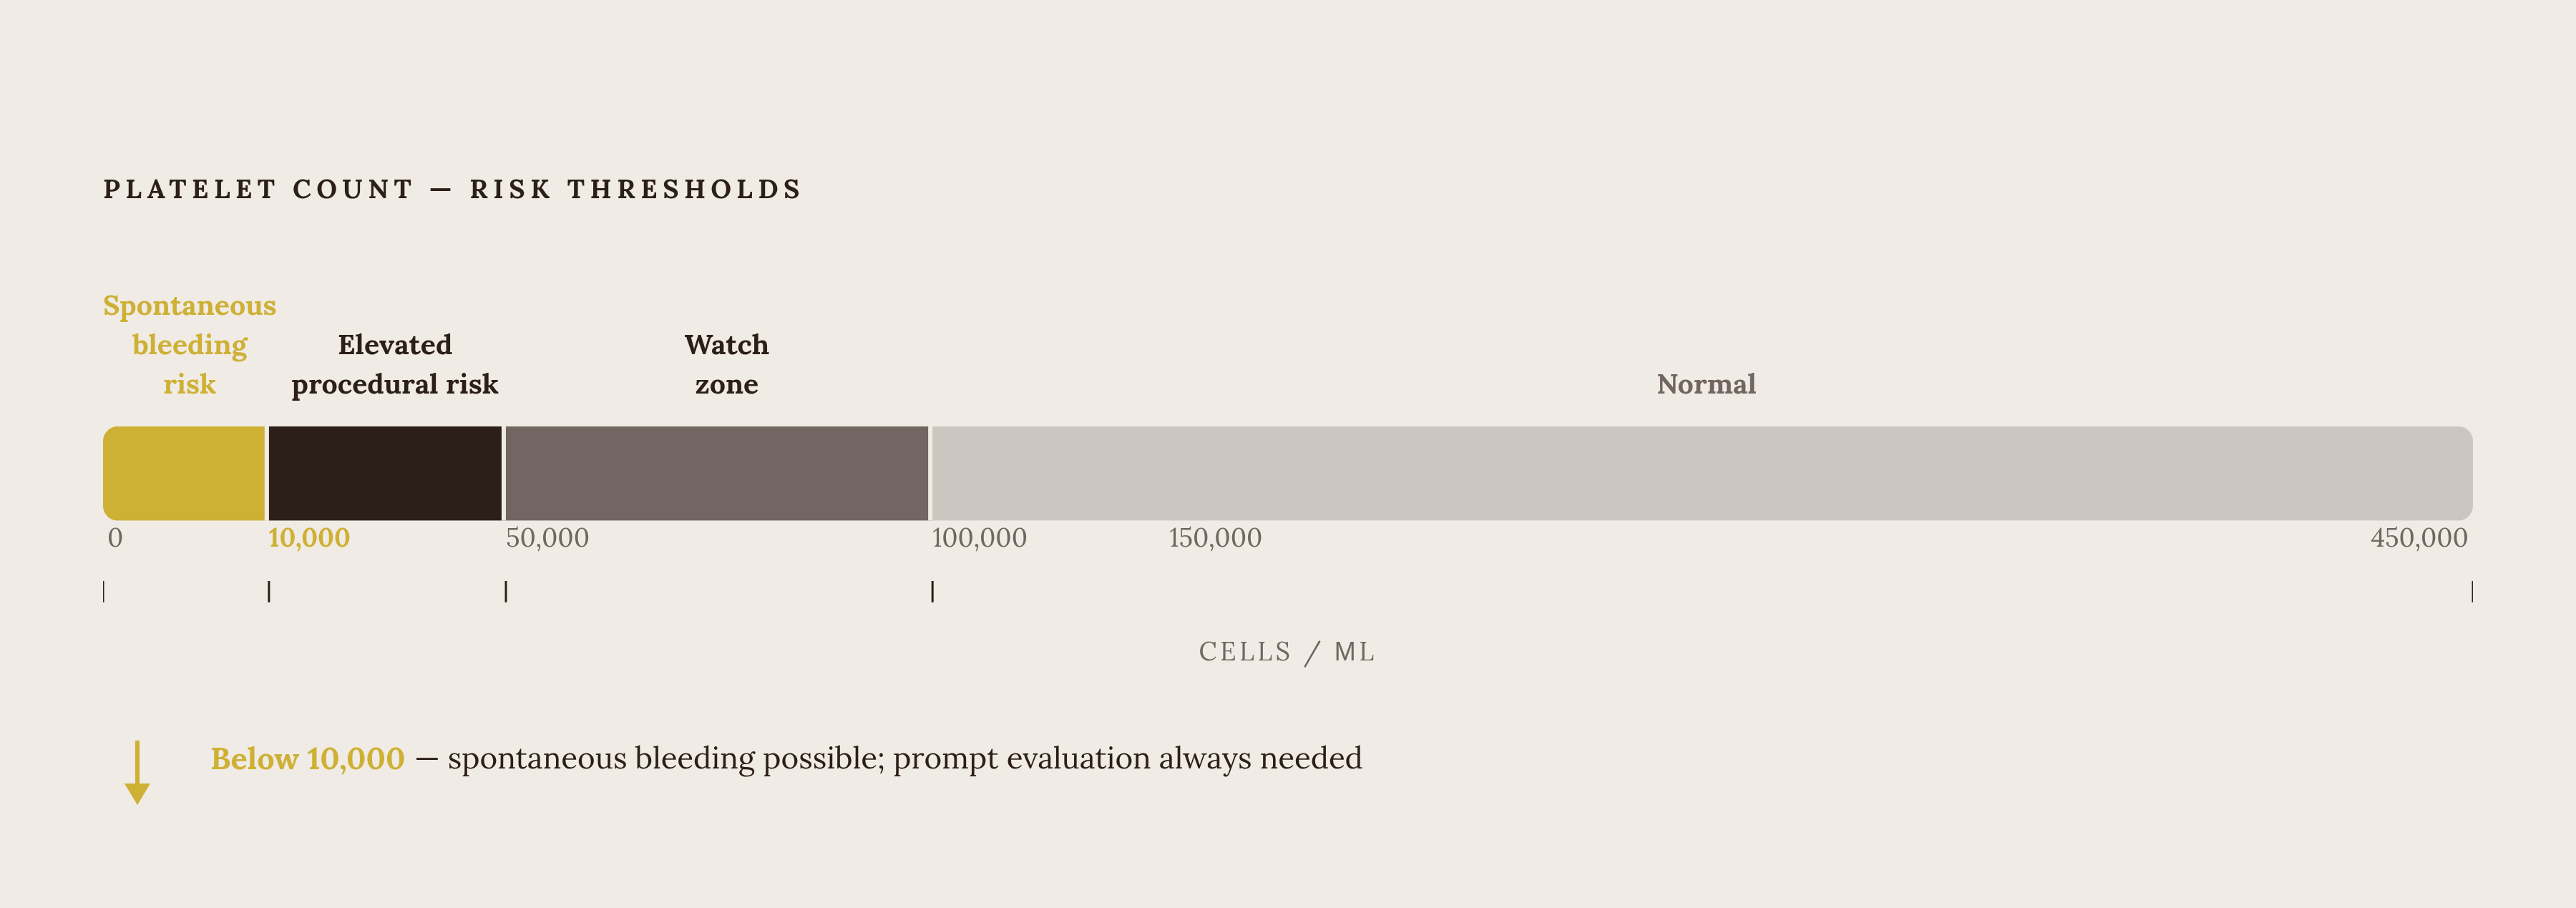
Platelets are the smallest cells in the blood, and their job is mechanical: when a vessel wall gets damaged, they clump together at the site to form a plug and kick off the clotting cascade. Too few, and bleeding risk climbs. Too many, and clotting risk climbs instead. The normal range runs 150,000 to 450,000 cells/dL.
A lot of unnecessary anxiety arises from this point. Plenty of people live in that zone permanently, with no symptoms and no problems whatsoever. That's a genuine safety buffer built into the numbers, not a red flag dressed up as one.
The thresholds that actually carry clinical weight sit further down. Below 100,000, the count warrants a clinician's attention, not because it's automatically dangerous, but because it signals something is happening, an infection, inflammation, a medication effect. Below roughly 50,000, bleeding risk rises specifically around invasive procedures, surgery, or if the person is also on a blood thinner. Below roughly 10,000, the risk shifts to spontaneous bleeding without any procedure involved, and that always calls for prompt medical evaluation.
A high platelet count is usually reactive, driven by infection, inflammation, or iron deficiency, and only needs deeper evaluation if it's persistent or markedly elevated. Platelets can also clump inside the collection tube itself, which tricks the analyzer into reporting a falsely low count. A repeat draw or a manual smear review sorts this out, and it's one more reason a single low platelet result shouldn't trigger panic before confirmation. Mean platelet volume, the average size of individual platelets, appears on many reports too; some cardiovascular associations have been noted at the high end of that measure, but it isn't a number readers need to parse on their own. Temporary dips tied to illness, hard exercise, or medication are expected and usually self-correct; a one-time low value that normalizes on repeat testing isn't something to act on.
When a flagged result genuinely warrants follow-up versus when it is likely noise
Magnitude, symptoms, and trend over time all decide which side of that line a result actually falls on.
A few patterns genuinely deserve a follow-up call. Hemoglobin or hematocrit sitting well below range, especially alongside fatigue, breathlessness, or pallor, belongs in that category. A white count that's very high or very low, particularly paired with fever, a lingering infection, or unexplained weight loss, belongs there too. A platelet count under 100,000, provided it's confirmed on a repeat draw rather than a single measurement, is worth attention. So is any single marker showing a clear, consistent direction across two or more draws over time, since that's the pattern that separates a real trend from a one-off blip. And when multiple markers land outside range at once, that combination points toward something systemic rather than an isolated quirk in one number.
On the other side, a slightly flagged MCV, MCH, or MCHC sitting next to a perfectly normal hemoglobin and hematocrit is, more often than not, exactly the kind of noise this whole piece has been pointing toward. One mildly high WBC with no fever, no infection, no explanation beyond a stressful week, fits the same pattern. A single low platelet reading that hasn't been repeated yet fits it too. None of these deserve panic. What they deserve is a second look, maybe a repeat draw, and a conversation with someone trained to read the full picture rather than one flagged cell in isolation.
Sources
- CBC Results: A Line-by-Line Reference Guide • The Blood Project
- (PDF) Complete Blood Count (CBC) Interpretation and Analysis: A Comprehensive Review for Medical Laboratory Professionals
- Normal and Abnormal Complete Blood Count With Differential - StatPearls - NCBI Bookshelf
- Mean Corpuscular Volume (MCV): Reference Range, Interpretation, Collection and Panels
- Mean Corpuscular Hemoglobin (MCH) and Mean Corpuscular Hemoglobin Concentration (MCHC): Reference Range, Interpretation, Collection and Panels
- Red Cell Distribution Width (RDW) Test: Interpretation of the Red Cell Distribution Width Test, Collection, and Panels: Overview, Interpretation of the Red Cell Distribution Width Test, Collection and Panels
- A Methodical Approach to Interpreting the Red Blood Cell Parameters of the Complete Blood Count | American Society for Clinical Laboratory Science
- A Methodical Approach to Interpreting the White Blood Cell Parameters of the Complete Blood Count | American Society for Clinical Laboratory Science