GFR and Creatinine for Kidney Function Assessment
Why creatinine alone can miss kidney disease that cystatin C or urine tests catch.
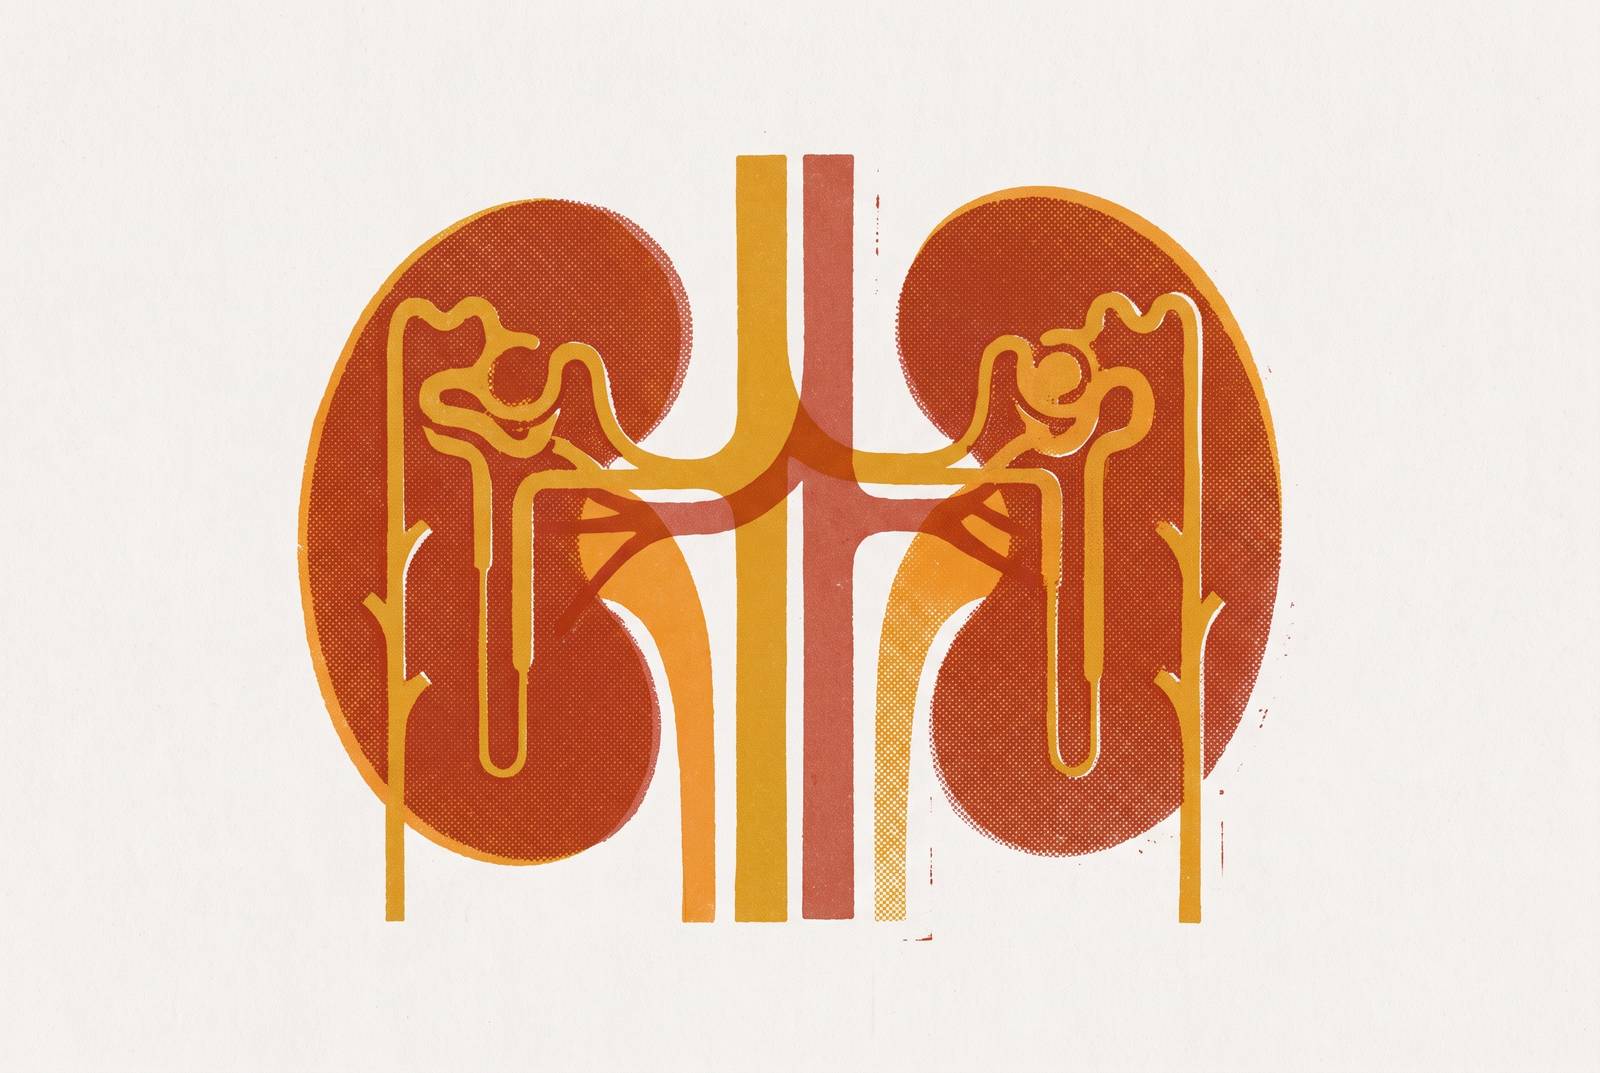
Creatinine is a waste product, plain and simple. It comes from normal muscle metabolism, made at a fairly steady rate as muscle tissue does its everyday work. The kidneys clear it out of the blood at a matching steady rate, so under normal conditions the level in the bloodstream stays fairly constant. When kidney function starts to slip, that balance breaks. Creatinine has nowhere to go, so it builds up in the blood, and that buildup is exactly what the test picks up.
The test itself is refreshingly uncomplicated compared to what comes next. A blood draw goes to the lab, and the lab reports back a number. No formula, no adjustment, no estimation involved at this stage. It is a direct measurement, full stop.
But what if two people have the exact same creatinine number and completely different kidney function? That happens more than you'd think, and it's the reason "normal" creatinine isn't one fixed number for everybody. Diet plays a role too: someone eating a lot of protein can push creatinine up without any change in kidney health. Dehydration, burns, malnutrition, certain medications, all of these can shift the reading in one direction or another. So the raw number needs context. It's a snapshot, not a verdict, and reading it in isolation misses most of what it's trying to tell you.
How eGFR is calculated from creatinine
Here's where the confusion usually starts. eGFR sounds like a lab measurement, the same as creatinine, but it's a calculated estimate, not a direct measurement. It's built by feeding creatinine, along with age, sex, and body size, into an equation designed to approximate a different, harder-to-measure quantity.
What is that quantity? Filtering happens inside structures called glomeruli, tiny filtration units inside the kidneys, of which the kidneys contain approximately 1 million. Each kidney holds roughly a million of them, and eGFR is essentially trying to capture their combined output, how much blood gets cleaned, collectively, in a minute.
Why not just measure that directly? Because true GFR requires injecting a tracer substance and tracking its clearance over time, which is accurate but impractical for a routine checkup. Creatinine offers a shortcut: since it's cleared almost entirely by the kidneys, its blood level correlates with filtration rate closely enough that an equation can back into a reasonable estimate. That's the whole premise of eGFR. It's an inference built from a proxy, not a direct readout, and that distinction matters for everything that follows.
The situations where creatinine-based eGFR gives an unreliable picture
Since eGFR is built on creatinine, it inherits every one of creatinine's blind spots. Anything that changes how much creatinine a person produces, independent of kidney function, will throw the estimate off. That's the central weakness of the whole approach. It's the central weakness of the whole approach.
Several situations make this especially pronounced. In acute kidney injury, creatinine hasn't had time to catch up with what's actually happening in the kidneys, so the eGFR calculated from it lags behind reality. Pregnancy changes things too, and so do oedematous states, where fluid retention muddies the numbers. Muscle wasting disorders and malnutrition push creatinine production down, which can make kidneys look healthier than they are. Flip that around: someone with very high muscle mass, or someone using protein or creatine supplements heavily, produces more creatinine than average, which can make perfectly fine kidneys look worse than they are. Amputation distorts the equation from the other direction, since body size inputs assume more muscle mass than the person actually carries.
Cancer deserves its own mention here. Everything about filtration markers that isn't actually about filtration shows up more prominently in cancer patients, and that drags down how accurate the equation is for them. KDIGO's 2024 guidelines specifically flag cancer patients as a population where this matters.
How big a problem is this in practice? One study found that 16% of patients only got correctly identified as having chronic kidney disease once cystatin C or albumin-to-creatinine ratio results were layered on top of creatinine eGFR readings that looked completely normal on their own https://www.ncbi.nlm.nih.gov/pmc/articles/PMC12435785/. That's not a rounding error. More than 1 in 7 US adults are estimated to have CKD, and as many as 9 in 10 of them do not know it yet.
So what should a reader take from this? A normal eGFR, if any of the conditions above apply, can mask an underlying problem. It's a prompt to look closer, not a stopping point.
What cystatin C adds
Cystatin C works from a different starting material entirely. It's a small protein, made continuously by essentially every cell in the body that has a nucleus, and it gets filtered out almost exclusively by the kidneys. That production pattern is the whole point: unlike creatinine, cystatin C output doesn't depend on muscle mass, diet, or whether someone's been taking creatine supplements. The variables that trip up creatinine-based eGFR mostly don't apply here.
That makes cystatin C particularly useful in a specific set of circumstances. Someone who's been hospitalized for a long stretch and has lost muscle mass from inactivity is a good candidate, since creatinine alone would understate how much kidney function has actually declined. Older adults are another group where it adds real value, and so is anyone with an unusual body composition, whether that's very low or very high muscle mass, where standard eGFR equations tend to drift.
Researchers at NYU Grossman School of Medicine looked at this directly and found that measuring creatinine and cystatin C together gives a more accurate read on kidney function than either one alone, especially in older and sicker patients. Measuring creatinine and cystatin C together isn't just marginally better than either one alone: it's the difference between an estimate confounded by a handful of unrelated variables and one that isn't. Neither marker replaces the other. They correct for each other's blind spots, which is the whole reason using both matters more in exactly the populations where creatinine alone tends to mislead.
The urine albumin-to-creatinine ratio and its role in staging kidney health
eGFR answers one question: how much blood is getting filtered. It says nothing about whether the filter itself is intact. That's a different question, and it needs a different test.
Urine albumin-to-creatinine ratio, uACR, answers that second question. Albumin is a protein that shouldn't leak into urine in meaningful amounts if the glomerular filtration barrier is doing its job. When albuminuria occurs, that's a sign the barrier has been damaged, even if the overall filtration rate captured by eGFR still looks fine. One test measures throughput. The other measures structural integrity. They're not redundant, they're complementary, and that's exactly why kidney disease staging leans on both rather than picking one.
What makes uACR especially valuable is timing. In patients with diabetes specifically, uACR often ends up being the earliest signal of kidney trouble available, well ahead of anything creatinine or eGFR would catch. Skipping it because eGFR looks fine means giving up a decade of lead time. The CKD diagnostic criteria include a uACR ≥30 mg/g sustained for three months or more alongside eGFR below 60.
The eGFR five-stage framework
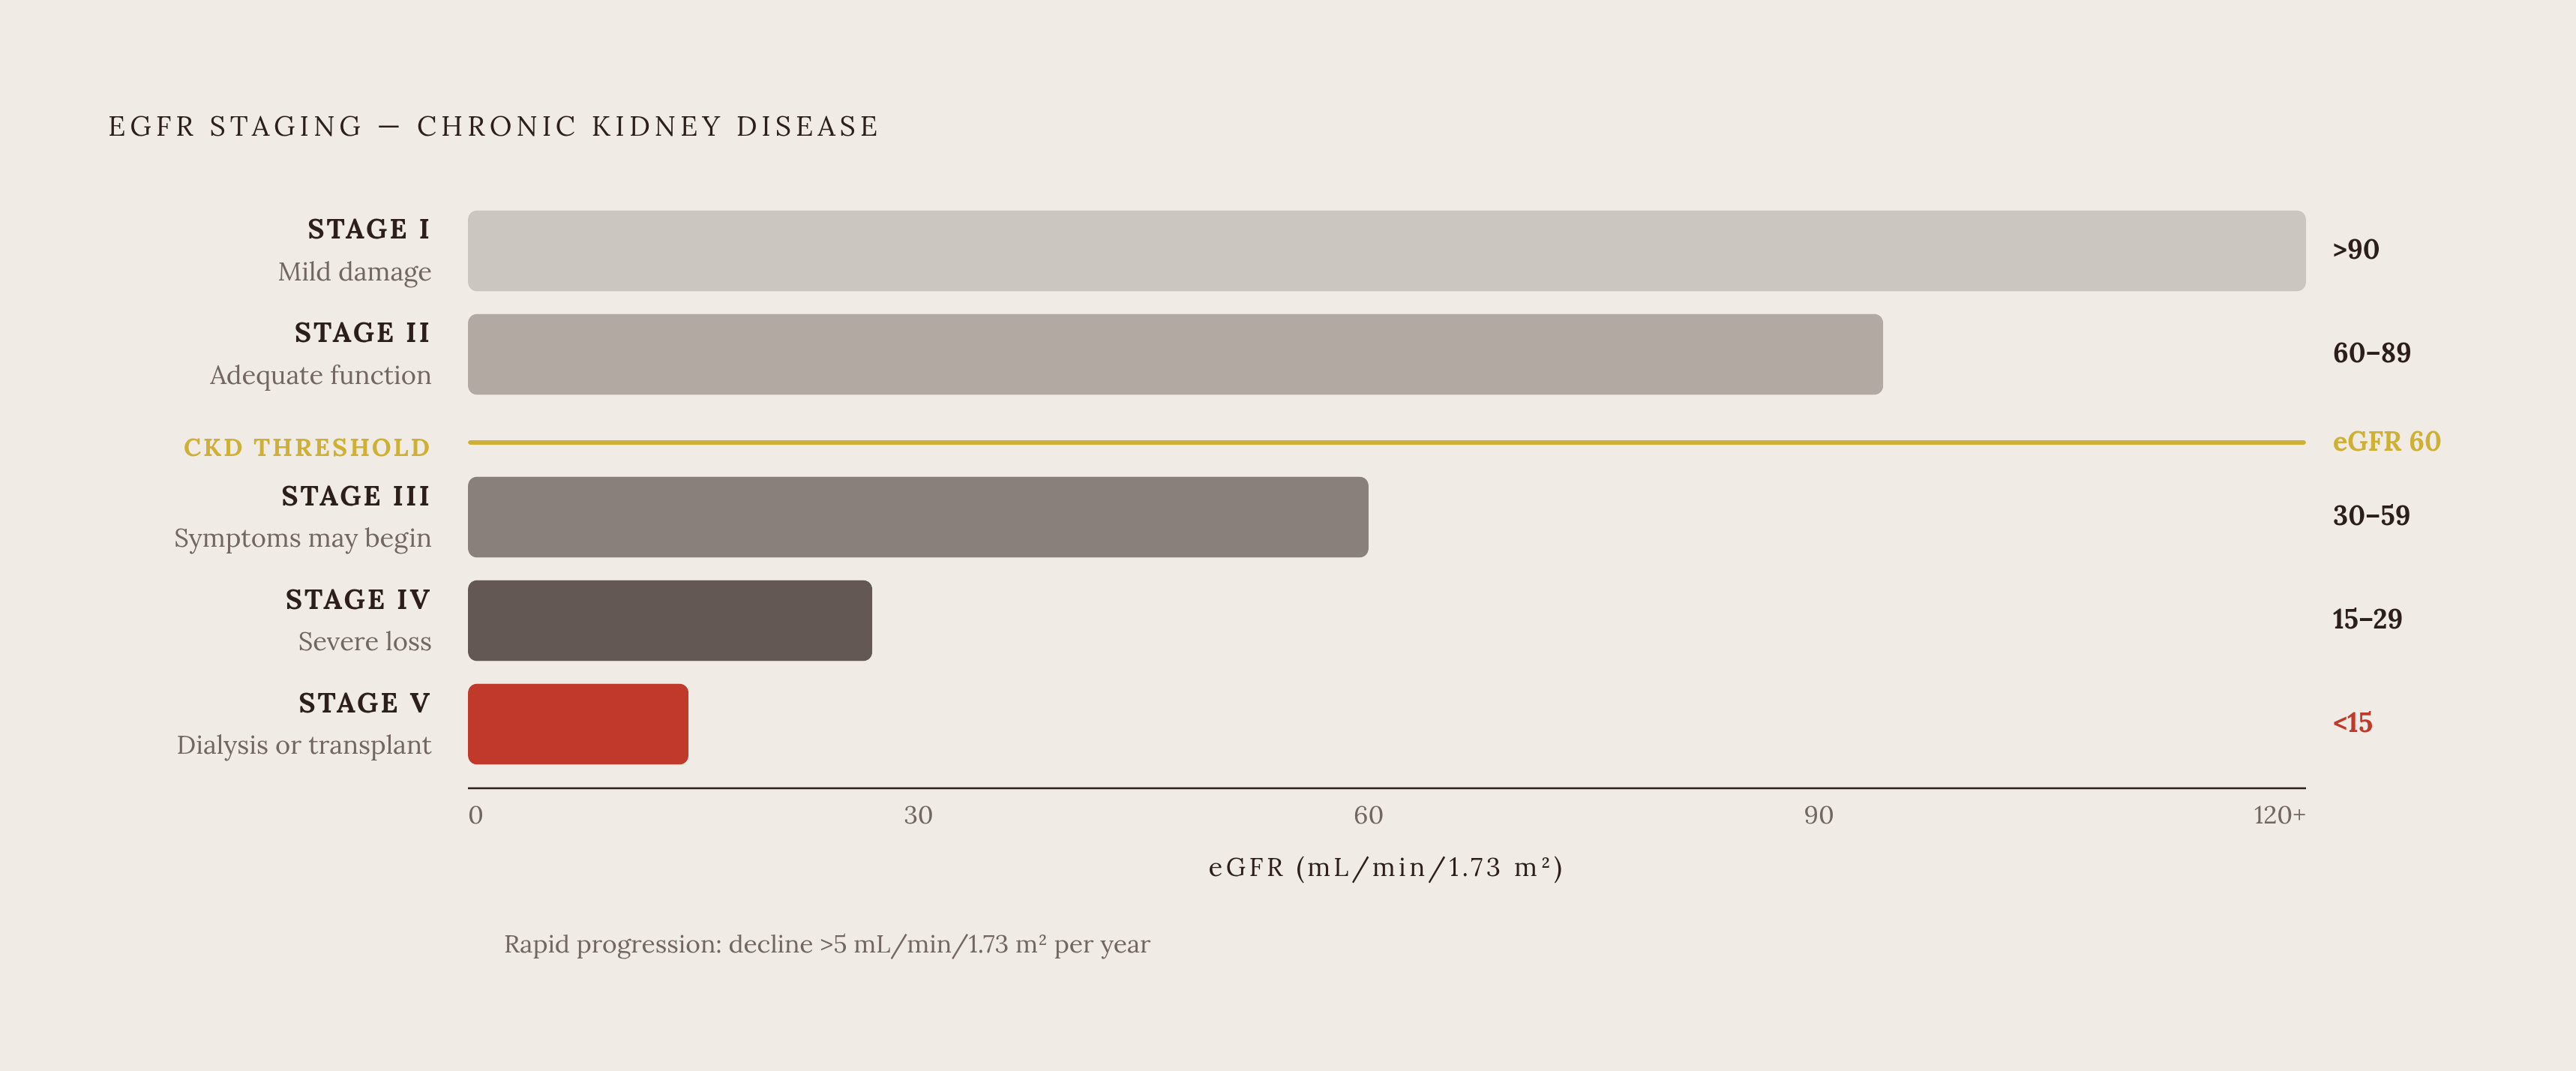
Once eGFR is in hand, the number gets mapped onto a five-stage framework that's become the standard language for describing kidney health.
Stage I covers eGFR above 90, where there might be mild kidney damage present, but the kidneys are still doing their job well. Stage V, below 15, means less than 15% of normal kidney function remains, and dialysis or a transplant typically becomes necessary at this point.
The diagnostic line for CKD itself is eGFR below 60, sustained for three months or more, or alternatively eGFR above 60 paired with a uACR above 30 mg/g, also sustained for three months. Either pathway qualifies. Note that this means someone can be diagnosed with CKD while their eGFR looks completely normal, provided the uACR crosses that line, which loops right back to why staging kidney health needs both markers rather than eGFR in isolation.
The rate of change matters as much as the number itself, arguably more. A decline steeper than 5 mL/min/1.73 m² per year counts as rapid progression. And a doubling of serum creatinine, which works out to a 57% drop in eGFR, over a one-to-three-year window is a strong predictor of eventual kidney failure https://www.kidney.org/sites/default/files/2024-08/ckd_evaluation_classification_stratification.pdf.
Age complicates the picture further. eGFR drifts downward with age on its own, without any disease process involved. An eGFR in the 50s carries far lower risk of progressing to kidney failure for an elderly patient than for a 40-year-old with the same number, particularly when there's no protein showing up in the urine. The numbers back this up starkly: incidence of kidney failure in elderly people without proteinuria is negligible, compared to 0.7 per 100 person-years in younger people without proteinuria https://www.kidney.org/kidney-topics/stages-chronic-kidney-disease-ckd. Same eGFR, wildly different trajectory. That's the kind of nuance a single number can't carry on its own. Stage II is defined as eGFR 60–89, reflecting increased damage while function remains adequate. Stage III is defined as eGFR 30–59, representing moderate to severe loss of function, with symptoms possibly beginning. Stage IV is defined as eGFR 15–29, representing severe loss of function.
The reasons most kidney disease goes undetected until advanced
The scale here is large. An estimated 37 million adults in the United States may have chronic kidney disease, and nearly 90% of them don't know it https://www.kidney.org/sites/default/files/2024-08/ckd_evaluation_classification_stratification.pdf. Put another way, more than 1 in 7 adults in the US are estimated to have CKD, and as many as 9 in 10 of those people are walking around unaware https://www.kidney.org/sites/default/files/2024-08/ckd_evaluation_classification_stratification.pdf.
Why does a disease this common stay hidden for so long? The biology explains it. CKD typically produces no symptoms at the stage when it's most treatable, and most people don't notice anything is wrong until kidney function has already dropped by something like 90%. It's a structural feature of the disease itself, built into how people pay attention to their health: the kidneys can lose the vast majority of their capacity while a person feels completely fine. It's a structural feature of the disease itself: the kidneys can lose the vast majority of their capacity while a person feels completely fine.
That silence has a cost. By the time symptoms force someone into a doctor's office, whatever window existed for slowing or reversing the decline has largely closed. Testing is the only way to see this coming before it announces itself, because the disease itself won't.
Who benefits most from kidney testing and testing frequency
A handful of risk factors flag who benefits most from proactive testing. Type 2 diabetes is near the top of that list, alongside high blood pressure, obesity, a family history of kidney disease, a prior episode of acute kidney injury, a history of smoking, and social factors like poverty or food insecurity that limit access to care. Age above 60 belongs on that list too, simply because kidney function trends downward over time regardless of disease.
One study tracking more than 2,000 CKD patients identified specific factors tied to faster eGFR decline: systolic blood pressure at or above 120 mmHg, low hemoglobin, diabetes, and moderately increased albuminuria, each one independently associated with quicker progression. None of these operate in isolation. Someone carrying two or three of them at once is a different risk profile than someone with just one, which is exactly the kind of layered picture a single eGFR reading can't convey on its own.
There's also a specific aging pattern worth naming. Researchers use the term "kidney accelerated aging" for older adults whose eGFR drops faster than 5 mL/min/1.73 m² per year, and that group warrants closer, more frequent monitoring than the general population https://www.kidney.org/kidney-topics/stages-chronic-kidney-disease-ckd.
The case for testing earlier than most people assume holds up. A coin flip, essentially, on a number that might otherwise get dismissed as unremarkable at a routine physical. That statistic alone makes a reasonable case for a baseline kidney panel sometime in one's 40s, well before the usual conversation about kidney health tends to start.
The cost of kidney tests through direct-access labs
Testing doesn't have to run through the traditional referral pipeline. Direct-access lab testing operates outside insurance billing entirely: in most US states, no doctor's order or referral is required to get a kidney panel drawn.
Price, though, varies more than you'd expect for what's fundamentally the same lab test. Take the Renal Function Panel, Quest Diagnostics test #10314, as an example: pricing across platforms runs from a confirmed low of $23.00 up to a confirmed high of $99.00, with the same test available through at least 14 different online lab test stores https://www.kidney.org/kidney-topics/estimated-glomerular-filtration-rate-egfr. That's more than a fourfold spread for identical bloodwork processed by the same lab. A related option, the Quest Renal Function Panel with eGFR, comes out to $32.22 total once a $10 requisition charge is added to the base price, through at least one direct-access platform https://www.kidney.org/kidney-topics/estimated-glomerular-filtration-rate-egfr.
The lesson here isn't complicated: shop before booking. The test itself doesn't change based on where it's ordered, but the markup does, and that gap is real money for something that takes five minutes and a single vial of blood. Individuals in their 40s with eGFR in the G3a range (45–60 mL/min/1.73 m²) have an approximately 50% probability of developing progressive CKD by age 80 years https://www.ncbi.nlm.nih.gov/pmc/articles/PMC12667306/. In an 11-month study of 400 patients screened at community pharmacies in the UAE (average age 69 ± 13.4 years), 38.8% (155 individuals) were found to have undiagnosed CKD stages 3–5 https://documents.cap.org/documents/ChronicKidneyDiseaseFullModule.pdf. Rising uACR (≥30 mg/g) detection occurs about 10 years before detectable decline in eGFR https://www.kidney.org/sites/default/files/2024-08/ckd_evaluation_classification_stratification.pdf.