LDL Particle Size and the Small Dense LDL Risk Pattern
Small dense LDL particles carry metabolic risk even when standard cholesterol tests appear normal.

A standard cholesterol result measures the cholesterol cargo carried by particles. Small dense LDL can point to a more dangerous metabolic pattern, even when LDL cholesterol looks normal. A fuller assessment is warranted for people whose metabolic health and LDL-C tell different stories.
Why a standard lipid panel measures the wrong thing
A person can have normal LDL-C and still experience a major cardiovascular event, including STEMI or stroke. Meanwhile, someone with moderately elevated LDL-C may remain free of atherosclerotic cardiovascular disease, or ASCVD. That contrast does not make LDL-C useless. To understand the gap, it helps to separate what the test measures from what travels through the arteries.
A standard lipid panel reports LDL cholesterol mass, written as LDL-C. This is the amount of cholesterol packed into all LDL particles combined. Two people can have the same LDL-C results even though the number and size of their particles are very different. The cholesterol mass inside a particle and the particle’s physical properties are separate variables. Treating them as interchangeable hides differences that matter to plaque formation.
What small dense LDL is and why its physical properties make it more dangerous
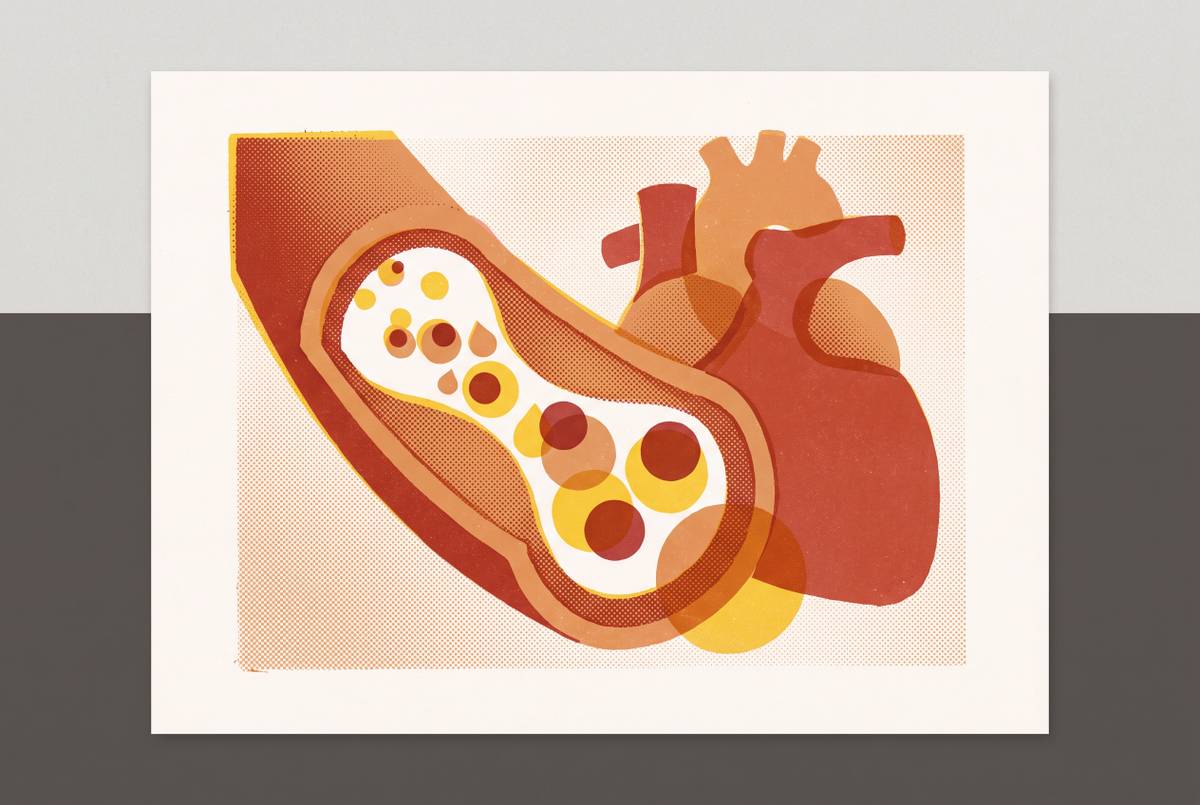
Small dense LDL, or sdLDL, is the particle type that brings this measurement gap into focus. These particles are 15–20 nm in diameter and have properties that make them more likely to promote atherosclerosis than larger LDL particles. Their danger rests on a combination of easier arterial-wall penetration, longer circulation time, and greater susceptibility to oxidation. Size matters here, but not in isolation. It works together with the particle’s chemistry and how well the body can clear it.
Because sdLDL has low affinity for the LDL receptor, the body removes it more slowly. That longer stay in circulation extends the window in which it can interact with the arterial wall. Its physical properties also make penetration into the wall easier. Once there, it is prone to oxidation, a chemical change that makes LDL more damaging. Oxidized LDL impairs the function of the artery’s inner lining, promotes foam cell formation, and triggers vascular inflammation.
Smaller, denser, more electronegative particles are also more prone to uptake by macrophages through scavenger receptors, helping accelerate plaque formation. A profile dominated by sdLDL presents a different biological problem from one dominated by large buoyant particles. This establishes a strong biological case for concern, though it does not by itself prove how much independent risk particle size adds in people.
How metabolic dysfunction produces the small dense LDL pattern
Small dense LDL is a predictable downstream product of insulin resistance and excess triglyceride production. Insulin resistance and hyperinsulinemia drive the liver to produce excess triglycerides and more VLDL1. Those changes supply the material for a sequence that remodels LDL.
Cholesteryl ester transfer protein exchanges triglycerides from VLDL into LDL particles. Hepatic lipase then breaks down those triglycerides, shrinking the LDL particle. The resulting pattern combines elevated triglycerides, reduced HDL cholesterol, and increased sdLDL. This is the atherogenic dyslipidemia pattern characteristic of metabolic syndrome and type 2 diabetes.
Researchers have proposed calling sdLDL-C “metabolic LDL-C” because it is specifically elevated in people with metabolic syndrome and type 2 diabetes. Diet can feed this pathway, since simple carbohydrates, especially fructose, promote liver triglyceride production. What the particles contain depends on the whole diet, including how much saturated fat a person eats. People with insulin resistance, metabolic syndrome, type 2 diabetes, or abdominal obesity are especially likely to receive false reassurance from normal LDL-C.
How strongly elevated sdLDL predicts cardiovascular events, and what the large-cohort evidence shows
Zubiran et al. 2025 studied estimated small dense LDL cholesterol, or E-sdLDL-C, in a UK Biobank primary prevention cohort. After adjustment for age, sex, systolic blood pressure, hypertension, type 2 diabetes, and blood pressure medications, E-sdLDL-C and ApoB remained the most significant lipid risk factors. After further adjustment for ApoB, LDL-C’s association with ASCVD reversed, while E-sdLDL-C retained a significant positive association.
That distinction matters because an association with sdLDL could otherwise reflect nothing more than a larger number of atherogenic particles. ApoB adjustment tests that explanation. The link that remained suggests that the small dense LDL pattern can help predict risk on its own. It does not, however, prove that particle size alone caused the additional events. Nor does the reversal of LDL-C’s association establish that LDL cholesterol is protective.
Ma et al. 2025 found stronger and more consistent associations overall between E-sdLDL-C and cardiovascular outcomes than for LDL-C, non-HDL-C, triglyceride-rich lipoprotein cholesterol, and ApoB. The findings were not uniform across populations. In CHARLS, the link with stroke was significant but the link with cardiac outcomes was not, while UK Biobank found links with both ischaemic heart disease and stroke. Associations were stronger in males than females. Both studies used Sampson’s equation to estimate sdLDL-C from a standard lipid panel, so their findings did not depend on advanced particle testing.
Where the clinical debate stands — particle size versus particle number, and what current guidelines actually say
The 2026 ACC/AHA/multisociety Guideline on Management of Dyslipidemia does not recommend routine advanced lipoprotein testing to estimate ASCVD risk or guide the start of lipid-lowering therapy. This includes gradient gel electrophoresis, density gradient ultracentrifugation, NMR spectroscopy, and ion mobility analysis used to assess subclasses or LDL particle size. Instead, the guideline gives ApoB a Class of Recommendation 2a for use in select patients. Its position puts particle number ahead of particle size. This is a substantive clinical judgment.
ApoB captures atherogenic particle number because each LDL, VLDL, IDL, and Lp(a) particle carries one ApoB molecule. The particle-number argument is that more particles mean more risk, regardless of size, and that size does not add exposure at a given ApoB level. ApoB also predicts risk more accurately than LDL-C when the results disagree, including when LDL-C is at goal but ApoB remains elevated. Most importantly, observational sdLDL associations do not yet show that an sdLDL-guided treatment strategy improves outcomes compared with ApoB-guided or LDL-C-guided care. That is a strong reason for guideline caution.
The counterpoint is the independent association in the Zubiran et al. 2025 analysis. It suggests that a particle-number-only account may not capture every part of the metabolic risk pattern. The honest conclusion is that ApoB remains the stronger, better-validated next test for most patients. Small dense LDL may tell more about risk in metabolic dyslipidemia, where the change in size has a clear basis in how the body works.
How sdLDL is actually measured, and what each approach costs and tells you
The available approaches answer different questions, so they are not interchangeable. The simplest is E-sdLDL-C, calculated with Sampson’s equation from triglycerides, total cholesterol, and HDL-C already present in a routine lipid panel. It requires no additional blood draw and has no incremental testing cost. This is an estimate rather than a direct measurement of particle size or count.
ApoB is the next step when the question is how many atherogenic particles are circulating. As a standalone addition to a lipid panel, its cash cost is relatively low, though no single price applies here. It does not distinguish small from large particles. Instead, it captures much of the risk information attributable to particle burden. For most patients, a standard panel that allows E-sdLDL-C to be calculated, along with ApoB, tells a great deal at little extra cost.
NMR LipoProfile uses nuclear magnetic resonance spectroscopy to provide particle-number data, Small LDL-P, LDL size classification, and the LP-IR insulin resistance score. It can tell more when a clinician needs to know about particle size or insulin resistance. Cash pricing varies by ordering route, and insurance coverage differs. Some plans cover it under preventive benefits, while others need a diagnosis code for hyperlipidemia or family history of premature cardiovascular disease. That variability makes a universal price range misleading.
NMR LipoProfile can be a qualified medical expense for HSA and FSA funds under IRS Publication 502. Some FSA administrators may ask for more paperwork, and limited-purpose FSAs exclude lab tests from coverage, while the guideline position remains against routine use. The case for NMR is strongest when its extra detail answers a specific question.
What drives sdLDL down — the lifestyle and pharmacological evidence
Because sdLDL formation is tied to triglycerides and insulin resistance, the main lifestyle targets sit upstream of the particle itself. They include reducing visceral fat through weight loss, restricting dietary carbohydrates, especially simple carbohydrates and fructose, and increasing physical activity. The aim is to change the metabolic conditions that keep producing small dense particles. This is broader than trying to move LDL-C alone. It also explains why particle composition can matter when assessing the effects of a lifestyle change.
The PREDIMED-Plus trial sub-study at Bellvitge Hospital provides randomized evidence in 202 patients with metabolic syndrome. It compared an energy-reduced Mediterranean diet and encouragement to get more physical activity with an energy-unrestricted Mediterranean diet alone. The intervention group had significant decreases in sdLDL cholesterol, intermediate-density lipoproteins, and VLDL triglyceride. Large LDL and large VLDL particles increased, producing a shift toward a less atherogenic lipoprotein profile. Because diet, energy reduction, and activity were combined, the finding supports the combined approach.
Dietary long-chain omega-3 polyunsaturated fatty acids, especially some preparations of these fats, can lower triglycerides and increase LDL particle size. A reduction in sdLDL-C is expected from that shift, which is a more cautious claim than a demonstrated cardiovascular outcome benefit. Medicines act through different routes. Statins reduce all LDL subfractions through LDL-receptor-mediated clearance, while fibrates are particularly relevant when elevated triglycerides dominate the pattern. Those mechanisms provide context for a clinician’s treatment decision.
A person whose pattern is driven by insulin resistance may need care that addresses that pathway even when LDL-C looks good. The same tests described above can track changes in particle burden and the small dense LDL pattern after a change in diet or treatment.
How to decide whether to go beyond a standard lipid panel, and what to ask for
The strongest reason to look further is a mismatch between reassuring LDL-C and signs of metabolic dyslipidemia. Triglycerides above 150 mg/dL, HDL below 40 mg/dL, or central adiposity despite normal LDL-C are high-yield signals. They identify a setting in which LDL-C alone may miss an important part of the risk profile. That pattern is a better trigger for deeper testing than a blanket recommendation.
Start with the standard lipid panel and ask whether E-sdLDL-C can be calculated from it. If you have an element of metabolic dyslipidemia, request ApoB with the panel. The 2026 ACC/AHA guideline supports ApoB in select patients, particularly those on lipid-lowering therapy with diabetes, elevated triglycerides, or low achieved LDL-C. This adds a better-established measure of particle burden before moving to more detailed testing. It also keeps the first step proportionate to the question.
Ask specifically about sdLDL or NMR LipoProfile when triglycerides are elevated but LDL-C appears normal. NMR may be useful when metabolic syndrome coexists with borderline or normal LDL-C, when a low-carbohydrate diet raises questions about particle-size shifts, or when the LP-IR score would change management. The purpose is to identify information that could matter to care. As estimated sdLDL-C is further validated and adopted, a basic panel may open this conversation without another test.
Sources
- Small dense LDL: An underestimated driver of atherosclerosis (Review) - PMC
- Superior prognostic value of estimated small dense LDL cholesterol for cardiovascular risk assessment: evidence from international cohort studies - Macao Polytechnic University
- Estimated Small, Dense LDL Cholesterol and Atherosclerotic Cardiovascular Risk in the UK Biobank - PubMed
- Superior prognostic value of estimated small dense LDL cholesterol for cardiovascular risk assessment: evidence from international cohort studies
- Superior prognostic value of estimated small dense LDL cholesterol for cardiovascular risk assessment: evidence from international cohort studies - PMC