White Blood Cell Differential Interpretation in a Routine CBC
Cell patterns in a differential reveal what a high WBC count actually means.
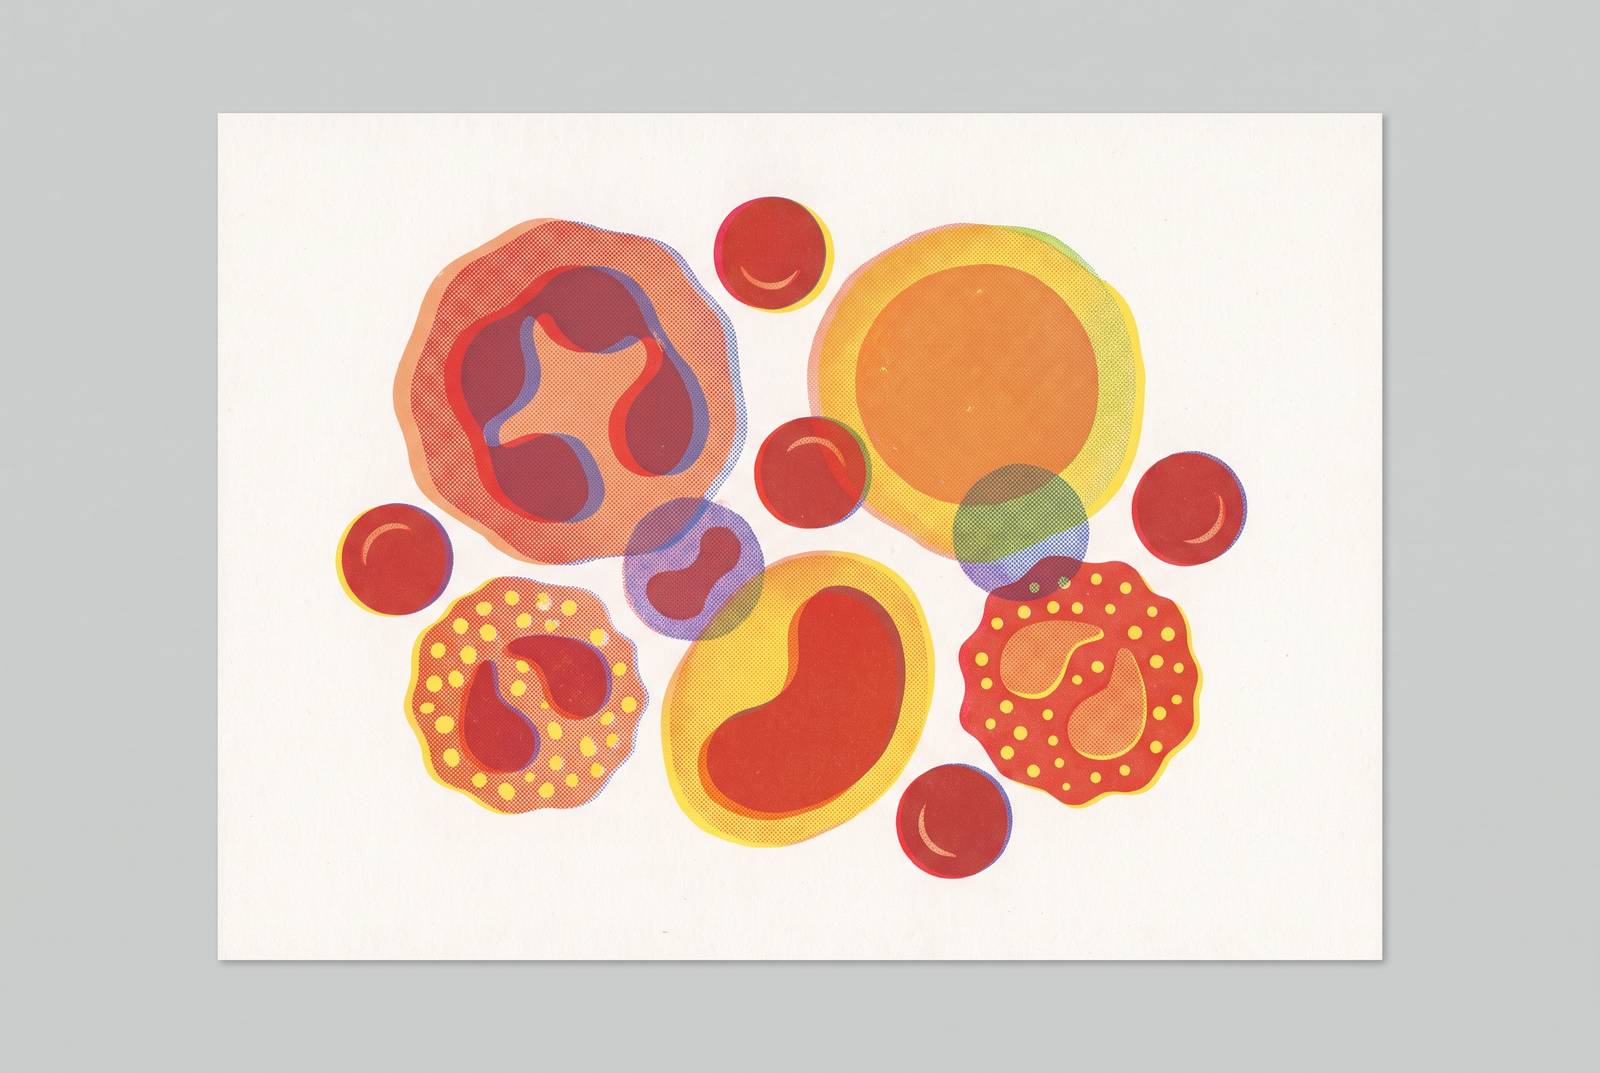
A white blood cell differential becomes useful when its five cell types are read together. The same total white blood cell count can point to bacterial infection, viral illness, allergy, or a bone marrow problem, depending on which cell types make up the total. Reading that mix starts with absolute counts, then widens to symptoms, medications, other CBC values, and changes over time.
What a CBC with differential actually reports and why the "differential" part changes everything
A complete blood count, or CBC, measures three bone-marrow lineages, which are red blood cells, white blood cells, and platelets. A plain CBC gives the total number of white blood cells. The differential adds the breakdown into neutrophils, lymphocytes, monocytes, eosinophils, and basophils, each reported as a percentage and usually an absolute count. Reports may call it “CBC with differential,” “CBC w/ diff,” “CBC with auto differential,” or “hemogram with differential.” These names refer to the same test.
“Auto differential” means an analyzer classified the cells using light scatter, electrical impedance, and staining. A manual differential means a technologist examined them under a microscope, usually after an analyzer flag for unusual cells or counts. The review’s comment may identify bands, metamyelocytes, or atypical lymphocytes that need interpretation.
Why percentage alone can point you in the wrong direction
A percentage describes a cell type’s share of the total, while an absolute count describes how many are present. Consider neutrophils at 70% with a total WBC of 3.2 ×10⁹/L. Multiplying the total by that fraction gives an absolute neutrophil count, or ANC, of 2.24 ×10⁹/L, which is normal. With a markedly elevated total WBC, a high neutrophil percentage can mean something quite different.
The lymphocyte percentage can fall just because another white-cell type rises, even when the absolute lymphocyte count, or ALC, is still in an acceptable range. The denominator has changed, while the lymphocyte count may remain unchanged. Doctors use absolute counts to decide what care is needed, though some reports give only percentages. For a reader comparing results, the relevant reference range is the one printed on that report, because ranges vary by lab, analyzer calibration, and patient population.
What each of the five subtypes is doing and what drives it up or down
Neutrophils are central to the pattern associated with bacterial infection and acute inflammation. An illustrative adult absolute range is 1.5–7.5 ×10⁹/L, subject to the lab’s own interval. But infection is not their only driver. Corticosteroids can raise neutrophils, while viral illness may leave them low-normal or mildly suppressed. A disproportionately low count can also be part of a marrow suppression pattern.
Lymphocytes help define the viral-illness or recovery pattern, with an illustrative absolute range of 1.0–4.0 ×10⁹/L. In that pattern, they may be high or at the high end of normal, and a manual review sometimes finds atypical lymphocytes. A low percentage alone does not show that lymphocytes are depleted. The distinction becomes clearer when the absolute count is read alongside the neutrophil count.
Monocytes can rise with chronic infection or an autoimmune process. Their illustrative absolute range is 0.2–0.8 ×10⁹/L. Persistence changes the question being asked about them. An elevated count that remains elevated beyond three months prompts further investigation.
Eosinophils are associated with allergy, parasitic infection, and drug reactions. An illustrative absolute range is 0.0–0.5 ×10⁹/L, though the report’s interval takes precedence. Corticosteroids can suppress them within hours. To make sense of a high count, a clinician needs to look at both what might have triggered it and the medication history.
Basophils have an illustrative absolute range of 0.0–0.1 ×10⁹/L. Their clearest role here is as a companion signal. When they rise with eosinophils, a marrow process enters the possible explanations. Repeated elevation deserves more attention than a single isolated flag.
How to read the five subtypes as a pattern rather than five separate flags
Imagine two reports with the same high total WBC counts. One has high neutrophils, a relative dip in lymphocyte percentage, and bands on manual review. The other has elevated lymphocytes, perhaps described as atypical, with neutrophils low-normal or mildly suppressed. The first suggests bacterial infection or acute inflammation, while the second suggests viral illness or recovery. The totals match, but the clinical questions differ.
Bands are immature neutrophils, and their appearance is called a “left shift.” In a neutrophil-dominant pattern, that detail strengthens the classic bacterial-infection picture. It does not make the CBC a diagnosis. The shorthand that bacteria push neutrophils up and viruses push lymphocytes up is a starting point to interpret alongside symptoms and medications.
Other combinations direct attention elsewhere. Eosinophils above 0.5 ×10⁹/L with a normal or mildly elevated total WBC suggest allergy, parasitic infection, or a drug reaction. If basophils also rise, the range of explanations widens to include a marrow process. Elevated monocytes with a mildly elevated total and relatively normal neutrophils fit a different pattern, including chronic infection or autoimmune disease. Duration then helps separate a temporary response from a persistent problem.
Marrow stress or suppression can cause low counts in more than one of the blood-cell lineages, which is known as pancytopenia. It can also appear as an abnormally low WBC with disproportionately depressed neutrophils, or a very high WBC with an unusual distribution. Not every pattern fits a familiar infection picture.
Results that require same-day follow-up rather than watchful waiting
Most flagged values on a routine CBC in a well adult are not emergencies. Blast cells are immature marrow cells that should not be circulating and can signal leukemia, requiring urgent hematology referral. An adult with a total WBC above 100 ×10⁹/L and no known cause also needs to be assessed urgently.
Several other findings need a clinician’s review if they last, though they may not be emergencies. These include an ALC above 5.0 ×10⁹/L for more than three months and an absolute monocyte count above 1.0 ×10⁹/L for more than three months. Eosinophils persistently above 1.5 ×10⁹/L, called hypereosinophilia, and repeated basophil counts above 0.2 ×10⁹/L also warrant follow-up. Symptoms and accompanying abnormalities still shape the response.
A CBC cannot diagnose leukemia or rule it out alone. Unusual white-cell distribution becomes more concerning when joined by unexplained anemia, low platelets, or pancytopenia. Very low platelets need to be checked promptly even without symptoms, while smaller drops may need a workup or affect the risk of bleeding during a procedure.
The red-cell and platelet values that round out a complete read
Hemoglobin is the quickest red-cell screen for anemia or polycythemia. The illustrative ranges are 13.5–17.5 g/dL for males and 12.0–16.0 g/dL for females. Hematocrit, the share of blood volume occupied by red cells, generally moves with hemoglobin and provides confirmation. Trends add another dimension to the reading. A steady fall from prior results deserves more attention than a one-time low-normal value.
When hemoglobin is low, mean corpuscular volume, or MCV, directs the anemia workup. A value below 80 fL means microcytic, which is most often linked to iron deficiency. An MCV of 80–100 fL is normocytic and can point to chronic disease, acute blood loss, or early iron deficiency. Above 100 fL means macrocytic, with possible explanations including B12 or folate deficiency, alcohol, liver disease, thyroid disease, or certain medications. High RDW with low MCV can help distinguish iron deficiency from thalassemia trait, which typically has normal RDW.
Platelets complete the picture, with a normal range of 150,000–400,000/µL. Mild elevations commonly react to infection, inflammation, or iron deficiency, while very high counts sometimes warrant evaluation for myeloproliferative disease. For patients on testosterone replacement therapy, elevated hematocrit deserves specific attention because it can raise thromboembolic risk and prompt dose reassessment. Across these measurements, combinations are more informative than isolated flags. White-cell abnormalities with low hemoglobin and low platelets make a marrow explanation more likely.
The neutrophil-to-lymphocyte ratio as a window on systemic inflammation and aging risk
The neutrophil-to-lymphocyte ratio, or NLR, divides the neutrophil count by the lymphocyte count. In well adults it is typically around 1–3. A value above 5 often points to physiologic stress or bacterial inflammation but does not by itself diagnose chronic disease. Morsy et al.’s January 2026 study in JACC Advances found that adults with higher NLR were more likely to die, whether or not they had cardiovascular disease, heart failure, or cancer. The study concluded that it could enhance population risk scores.
Aging can dysregulate immune responses, shifting cell proportions and increasing inflammatory mediators, a process called “inflammaging.” Immunosenescence also disrupts immune surveillance, increases cancer risk, and fosters chronic low-grade inflammation. Yet people do not follow identical trajectories. Genetics, lifestyle, and environment help explain why people differ, so measurements taken over time tell more than a single ratio used to predict one person’s future.
What lifestyle factors actually move the differential over time
Because some drivers of immune aging are modifiable, the differential can serve as a feedback tool over months and years. There is evidence for the Mediterranean diet, caloric restriction, and microbiome-supportive diets. These approaches can support gut barrier integrity, modulate systemic inflammation, and improve adaptive immunity. Physical activity, adequate sleep, and stress reduction also support immune resilience. They act on overlapping parts of the same inflammatory system.
For readers tracking their differential, the practical emphasis is on diet quality, exercise, sleep, and stress load. These are the same behaviors that support cardiovascular and metabolic health. Changes in NLR are best considered across repeated measurements.
Pharmacological research belongs in a different category. Dasatinib combined with quercetin has been studied for clearing senescent cells, which promote inflammation through cytokines including IL-6 and TNF-α, and for reducing inflammation and improving metabolic function in aging individuals. Metformin has been studied for reducing proinflammatory cytokines and improving macrophage and T-cell function. Neither approach is a standard recommendation for immune optimization in healthy people.
Why context — medications, timing, and baseline variation — can make the same result mean different things in different people
Reference ranges describe populations. As of April 2026, many adult labs still use broad intervals that do not account for age, smoking status, pregnancy, or ethnicity-related baseline differences. Sex and current medications also affect interpretation. A person’s counts may stay steady at an unusual point within those intervals or outside them. That limits what a flag alone can establish.
Corticosteroids show how quickly context can change the reading. They raise neutrophils and suppress eosinophils within hours. With those changes in cell counts, someone taking a steroid burst for an asthma flare may have a pattern that looks like bacterial infection. Without the medication history, the explanation can go astray. Timing is part of the result.
The same caution applies to population-derived NLR thresholds. A threshold associated with risk across a study population may not translate neatly to someone with an unusual but stable baseline. Serial testing helps resolve that uncertainty. Two or three results over several months can establish a personal comparison, making deviations easier to interpret. For nonurgent tracking, access barriers such as needing another appointment and referral for a repeat CBC six months later can make that useful sequence harder to obtain.
How to get the test, what it costs, and what to do with the results
A CBC with differential is widely available and among the more affordable blood tests, but the route to testing affects the bill. Medicare reimbursement for CPT 85025 is a fraction of what hospital outpatient labs may charge without insurance. An uninsured office visit to obtain an order can cost more than ordering the test directly. Access costs can outweigh the test itself. Direct-access testing can also offer the same cash price in a major city or rural area, though residents of New York, New Jersey, and Rhode Island need a clinician order.
When the results come back, compare the absolute counts with the report’s reference ranges and read all five subtypes together. Then place that pattern beside hemoglobin, platelets, medications, symptoms, and prior results. If the pattern is ambiguous or has changed, bring the comparison to a clinician.