Uric Acid Levels and Metabolic and Cardiovascular Risk
High uric acid signals heart risk beyond gout, but lowering it doesn't yet prevent disease.
Serum uric acid is more than a gout marker. It can also signal metabolic strain and cardiovascular risk before symptoms appear. Understanding that signal means looking beyond a lab’s “normal” label, while keeping one distinction clear. Evidence that uric acid helps identify risk is not the same as proof that lowering it with medication prevents heart disease in people without symptoms.
Why uric acid has been misread as a gout-only marker
A lab report shows whether a result is within its reference range. A proactive patient needs to know something different. Does that number point to a health risk that needs attention? For uric acid, those questions can produce different answers because the conventional upper limits were built around gout.
For most of clinical history, uric acid drew attention chiefly when joints hurt. The usual point for concern was approximately 6.8 mg/dL, where urate can form crystals in joints. That framing left people with elevated levels but no gout symptoms with little reason to investigate. Research into blood pressure, inflammation and insulin resistance now gives that number a broader role, though its value as a treatment target remains less certain.
How the body produces and clears uric acid, and where the modern diet intervenes
Uric acid is the end product of purine metabolism. Purines come partly from foods such as red meat, organ meat and shellfish, and partly from the turnover of the body’s own cellular material. The liver processes them into uric acid, with the enzyme xanthine oxidase performing a key conversion. Production is only half of the balance. Blood levels also depend on how efficiently the body clears what it makes.
The kidneys remove most uric acid, while the remainder passes through the intestines. Kidney transporters, including URAT1 and GLUT9, help govern how much is reabsorbed or excreted. Genetic differences in these transporters partly explain why two people eating the same diet may have different results. Kidney dysfunction can further reduce clearance. This helps explain why people with chronic kidney disease, or CKD, often also have high uric acid.
Diet can disturb that balance through more than purines. Fructose metabolism generates urate, accelerating the route that breaks down purines even when dietary purine intake is unchanged. A daily sugary soft drink therefore acts through a different route from a bowl of shellfish. Alcohol can increase production and reduce excretion, while obesity affects both sides of the balance too. Diuretics and certain other medications can also raise levels, so an elevated result is not simply a verdict on someone’s food choices.
The three biological pathways connecting elevated uric acid to cardiovascular and metabolic damage
The first pathway involves blood pressure regulation. Uric acid can stimulate the renin-angiotensin-aldosterone system, or RAAS, promoting sodium retention, higher blood pressure and damage to the kidneys’ small vessels. Animal models show that hyperuricemia, the term for elevated blood uric acid, can itself induce hypertension through these mechanisms. Human findings are suggestive. In adolescents, elevated urate correlates with newly developing primary hypertension, placing the connection early in life.
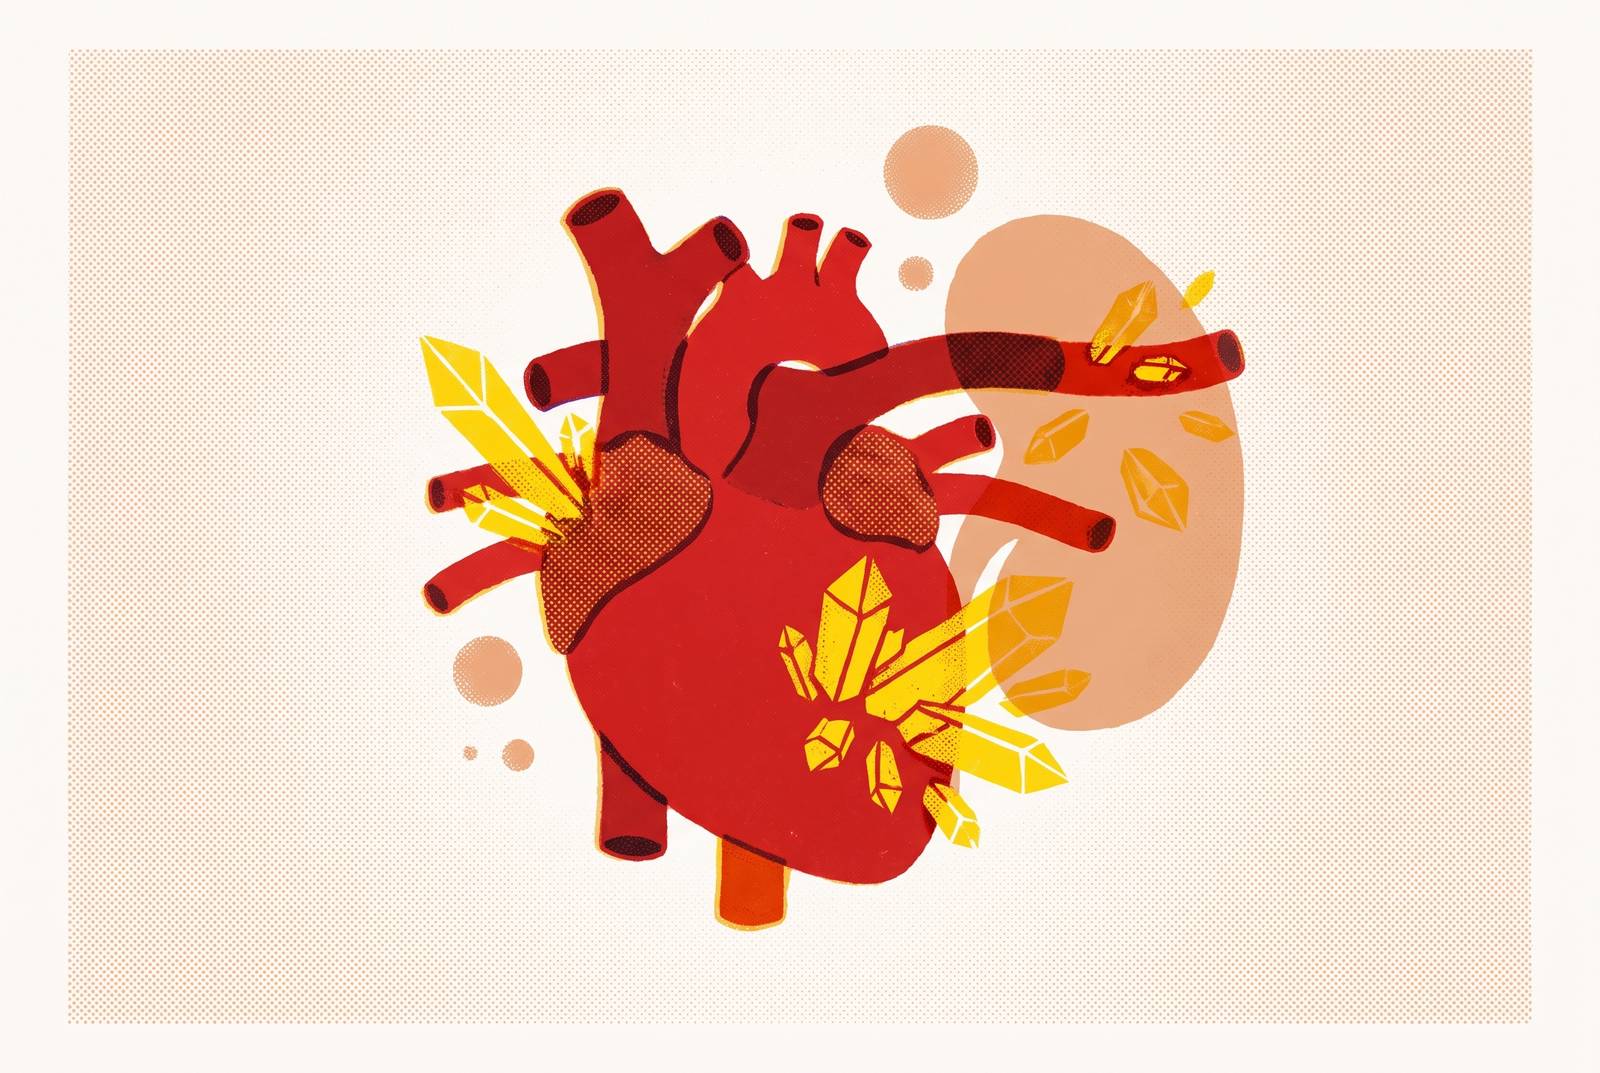
The second pathway involves the immune system. Hyperuricemia can activate the NLRP3 inflammasome and change the behavior of macrophages, immune cells involved in inflammation. These processes promote the chronic vascular inflammation that helps atherosclerotic plaques develop and progress. The concept of “vascular gout” adds another possible mechanism. Monosodium urate crystals can deposit within vessel walls and plaques, where they may trigger immune activation and plaque instability even in people who have never had a gout attack.
That helps resolve an apparent contradiction in symptom-free patients. Advances in dual-energy computed tomography have made deposits in vessel walls detectable, moving this part of the discussion beyond hypothesis alone. Yet an important uncertainty remains. It is still unknown whether lowering uric acid in blood removes those deposits.
The third pathway links uric acid with insulin resistance. Oxidative stress involving uric acid can impair insulin sensitivity and secretion, making elevated levels both a consequence of and a contributor to metabolic dysfunction. The 2026 Hakka Biobank study found that people with both elevated serum uric acid and an elevated TyG index, a proxy for insulin resistance, had much greater odds of advanced cardiovascular-kidney-metabolic syndrome than those with either marker elevated on its own. The combined association was particularly pronounced in women. These markers overlap, but they do not describe identical biological vulnerability.
What the cardiovascular outcomes evidence actually shows, and what it doesn't
Does uric acid cause cardiovascular disease, and would lowering it prevent events? Mendelian randomization studies use genetic susceptibility to help investigate the first question. The 2026 pooled evidence initially linked genetically predicted higher urate with several outcomes, including coronary disease, myocardial infarction, atrial fibrillation and heart failure. After stricter restrictions on the genetic data sources, however, myocardial infarction and coronary artery disease retained the most consistent support.
That narrowing is a strength of careful science. It suggests that uric acid is a credible causal contributor to coronary disease specifically, without establishing a broad causal effect across every cardiovascular outcome. Findings for atrial fibrillation and heart failure were less robust under stricter analyses. More importantly, genetic evidence does not directly establish a benefit from medication. A risk signal and a useful treatment target are different claims.
Trials have not shown a consistent reduction in cardiovascular events when urate-lowering therapy is added to guideline-directed treatment in asymptomatic hyperuricemia, stable ischemic heart disease, chronic heart failure or CKD. One possible explanation is that reducing blood levels may not clear existing vascular crystals. That explanation for the trial results remains unproven and requires investigation.
The Clinical Practice Research Datalink Aurum study offers a more encouraging but narrower finding. In this observational study, gout patients who reached serum urate below 6 mg/dL within 12 months of starting treatment had a lower five-year risk of major adverse cardiovascular events than those who did not. It does not establish that prescribing urate-lowering medication to symptom-free people will prevent heart attacks.
Why the thresholds on most lab reports give a false sense of safety
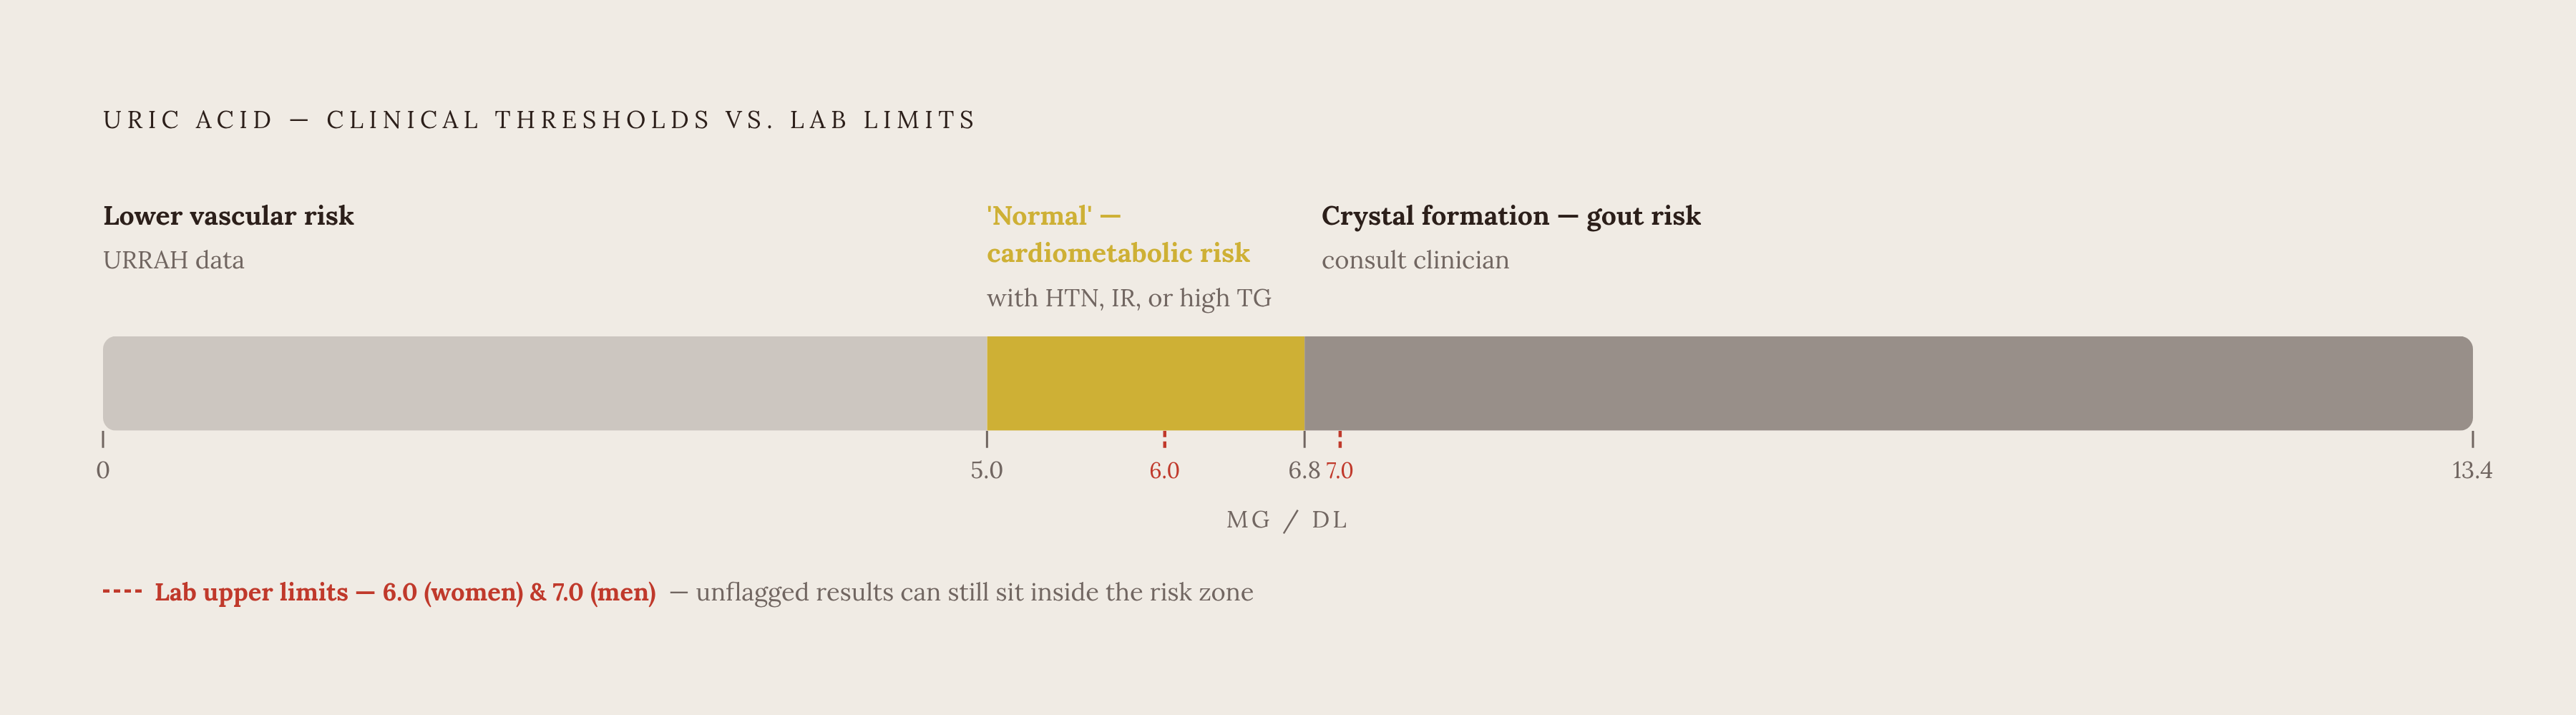
Standard laboratory reference ranges are roughly 2.4–6.0 mg/dL in women and 3.4–7.0 mg/dL in men. Those ranges were built for a different purpose from judging cardiovascular risk. A value can therefore be unflagged while still deserving attention in someone with hypertension, insulin resistance or abnormal lipids.
The URRAH, or URic acid Right for heArt Health, project found a risk association in which around 5.0 mg/dL was a more useful threshold for predicting cardiovascular mortality in high-risk populations than the traditional 7.0 mg/dL cutoff, without establishing a universal treatment trigger. It fits with mechanisms affecting insulin signaling, vessel function and inflammation below the joint-crystallization threshold. For example, a man whose result is 6.2 mg/dL may see “normal” on his report. If he also has elevated blood pressure or insulin resistance, that label should not end the interpretation.
Sex further complicates any single cutoff. The Hakka study found a J-shaped relationship between uric acid and advanced cardiovascular-kidney-metabolic syndrome, more pronounced in women. That pattern cautions against assuming that ever-lower levels are always better. It also reinforces why a male reference range cannot serve as a universal guide to metabolic risk.
How uric acid fits into a broader cardiometabolic panel rather than standing alone
High-sensitivity C-reactive protein, or hs-CRP, tracks inflammation that overlaps with the pathways discussed earlier. When both results are high, they call for a closer look at inflammation, though neither result on its own shows which vascular process is at work. Fasting glucose and the TyG index add another angle. They help describe insulin-related dysfunction, while uric acid reflects purine metabolism and oxidative stress.
Creatinine and estimated glomerular filtration rate, or eGFR, from a Comprehensive Metabolic Panel help assess the clearance side of the equation. Impaired kidney function can raise uric acid, while uric acid-related microvascular damage may reinforce kidney problems. ApoB and lipid markers then add information about atherosclerotic risk.
TestWell order data show that the large majority of uric acid tests are ordered with a Comprehensive Metabolic Panel, Lipid Panel and hs-CRP. For a reader already planning tests for ApoB, hs-CRP, fasting glucose and a metabolic panel, a uric acid test can add information about risk from the same blood sample. The incremental cost is small, while the interpretation is richer than a uric acid result read alone.
What lifestyle changes most reliably move uric acid levels, and what the supplement evidence actually supports
For someone with an elevated result, lifestyle change is the supported first step. Reducing red meat, organ meats and shellfish lowers the dietary purine load feeding production. Cutting fructose and high-fructose corn syrup, especially from sugary drinks, addresses the separate fructose-driven route. These are specific ways to “eat better. Their effects vary, but each targets a mechanism that can raise uric acid.
Weight loss can reduce production and improve kidney clearance. Moderating alcohol, particularly beer and spirits, addresses another contributor to higher production and reduced excretion, while increased hydration supports clearance. Expert consensus supports these changes as an early, individualized approach, especially in people with high cardiovascular risk. Improvements in insulin sensitivity, inflammation and blood pressure can support cardiometabolic health even while uncertainty remains about uric acid’s exact causal share.
Supplements have a more limited supporting role. The 2025 pooled evidence found that folic acid and probiotics reduced uric acid compared with conventional therapy, with folic acid showing the larger effect. Vitamin C mildly promotes uric acid excretion and produces a modest but measurable reduction. Evidence that a supplement lowers a blood marker does not establish that it prevents cardiovascular events.
Medication belongs in a separate clinical conversation. Xanthine oxidase inhibitors act on the production enzyme described earlier, but preventive testing does not by itself establish a reason to prescribe them. Decisions about pharmacological management require individual assessment.
When to test, what to ask for, and how to read the result in context
The mechanisms point toward who has the most to gain from proactive testing. High fasting glucose, abdominal obesity, high triglycerides, low HDL or high blood pressure make a uric acid result more useful because they point to related metabolic strain. A family history of gout, cardiovascular disease or CKD also supports testing, as do a high-fructose or high-purine diet and heavy alcohol intake. Women approaching or past menopause have another reason to consider it. Estrogen promotes uric acid excretion, so losing that protection changes the risk picture.
A standard serum uric acid test is inexpensive. Through direct-to-consumer channels, it can be ordered without a physician visit, referral or insurance card. The practical request is for serum uric acid interpreted with the metabolic, inflammatory and kidney markers already discussed.
A level below approximately 5.0 mg/dL fits with lower vascular risk in the URRAH data, but does not show that overall cardiovascular risk is low. Maintaining supportive lifestyle habits remains appropriate. Around 5.0–5.5 mg/dL and above, particularly with other risk factors, monitoring and lifestyle changes become more relevant. Above approximately 6.8 mg/dL, crystals can form, which makes gout a clearer concern and is a reason to speak with a clinician. With a result labeled normal in the 5–7 mg/dL range, a person can still have cardiometabolic risk or develop gout.
After a high result, the lifestyle changes described here can have effects that can be measured within weeks. Retesting in three to six months can help track the response. Persistently elevated levels, or abnormalities in other cardiovascular and metabolic markers, are reasons to involve a clinician for individualized assessment. The useful endpoint is understanding what that number adds to the whole picture and having a concrete plan for what comes next.
Sources
- Frontiers
- Redefining Uric Acid and Cardiovascular Risk: Vascular Gout and Crystal-Driven Vascular Inflammation in Asymptomatic Hyperuricemia
- Frontiers
- Urate-lowering therapy in cardiovascular pharmacotherapy: from Mendelian randomization data to cardio–renal–metabolic risk modulation
- Expert consensus for the diagnosis and treatment of patients with hyperuricemia and high cardiovascular risk: 2025 update - European Journal of Internal Medicine
- Hyperuricemia in 2025: Epidemiology, Mechanisms, Associated Conditions and Treat-to-target Management - Onkaramurthy Mallappa, Mohammed Azeemuddin Mukhram, Yogendra Nayak, Mohamed Rafiq, 2026
- Review began 09/22/2025 Review ended 10/06/2025 Published 10/11/2025