Sex Hormone Biomarker Panel Interpretation for Adults
Normal hormone results can mask real deficiencies when you ignore SHBG and other markers.
Interpreting a sex hormone biomarker panel for adults means reading a system. Total testosterone, free testosterone, SHBG, estradiol, FSH, and LH reveal different parts of that system. A result inside the lab’s reference range can still need a closer look when the other markers, symptoms, or personal history tell a different story.
Why a sex hormone panel is harder to read than your lab report suggests
The report arrives with mostly “normal” flags, yet the symptoms that prompted testing have not gone away. Is the report reassuring, or is it missing something? A reference range shows the values found in a large group of people from different backgrounds. It does not establish what is optimal for the person reading it, and a value near its lower edge can coexist with real symptoms.
Total testosterone shows the overall amount, while free testosterone and SHBG help explain how much is available. Estradiol, FSH, and LH add information about conversion and hormonal signaling.
What SHBG actually does and why it changes everything downstream
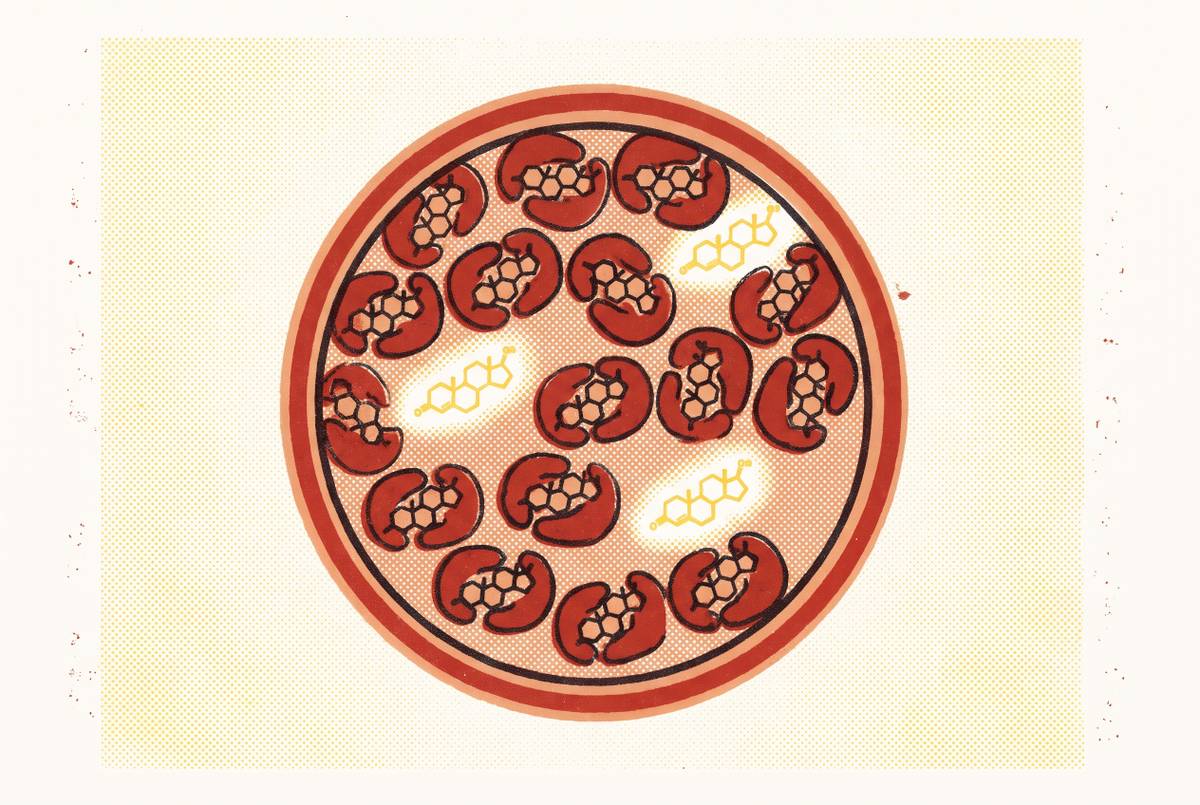
SHBG binds the majority of circulating testosterone, making it central to understanding what the total result means. Only roughly two to three percent of circulating testosterone is free and unbound. The rest is bound to SHBG or albumin. Two people with identical total testosterone can therefore have different free testosterone levels, and different symptoms, depending on their SHBG.
The binding protein is also a metabolic signal. Low SHBG is associated with insulin resistance, metabolic syndrome, obesity, inflammation, hypothyroidism, Type 2 diabetes, and anabolic steroid use. High SHBG is associated with aging, liver disease, and hyperthyroidism. These associations give an abnormal result meaning beyond testosterone binding.
In women, low SHBG is particularly relevant when evaluating androgen excess and ovulatory dysfunction, including suspected PCOS. Reading it with free testosterone helps connect the metabolic and reproductive picture. The relationship is useful, but not universally decisive. There is still little evidence to support wider use in diagnosis, though it can be helpful in some cases where SHBG is altered.
The concrete scenario where "normal" total testosterone masks a real deficiency
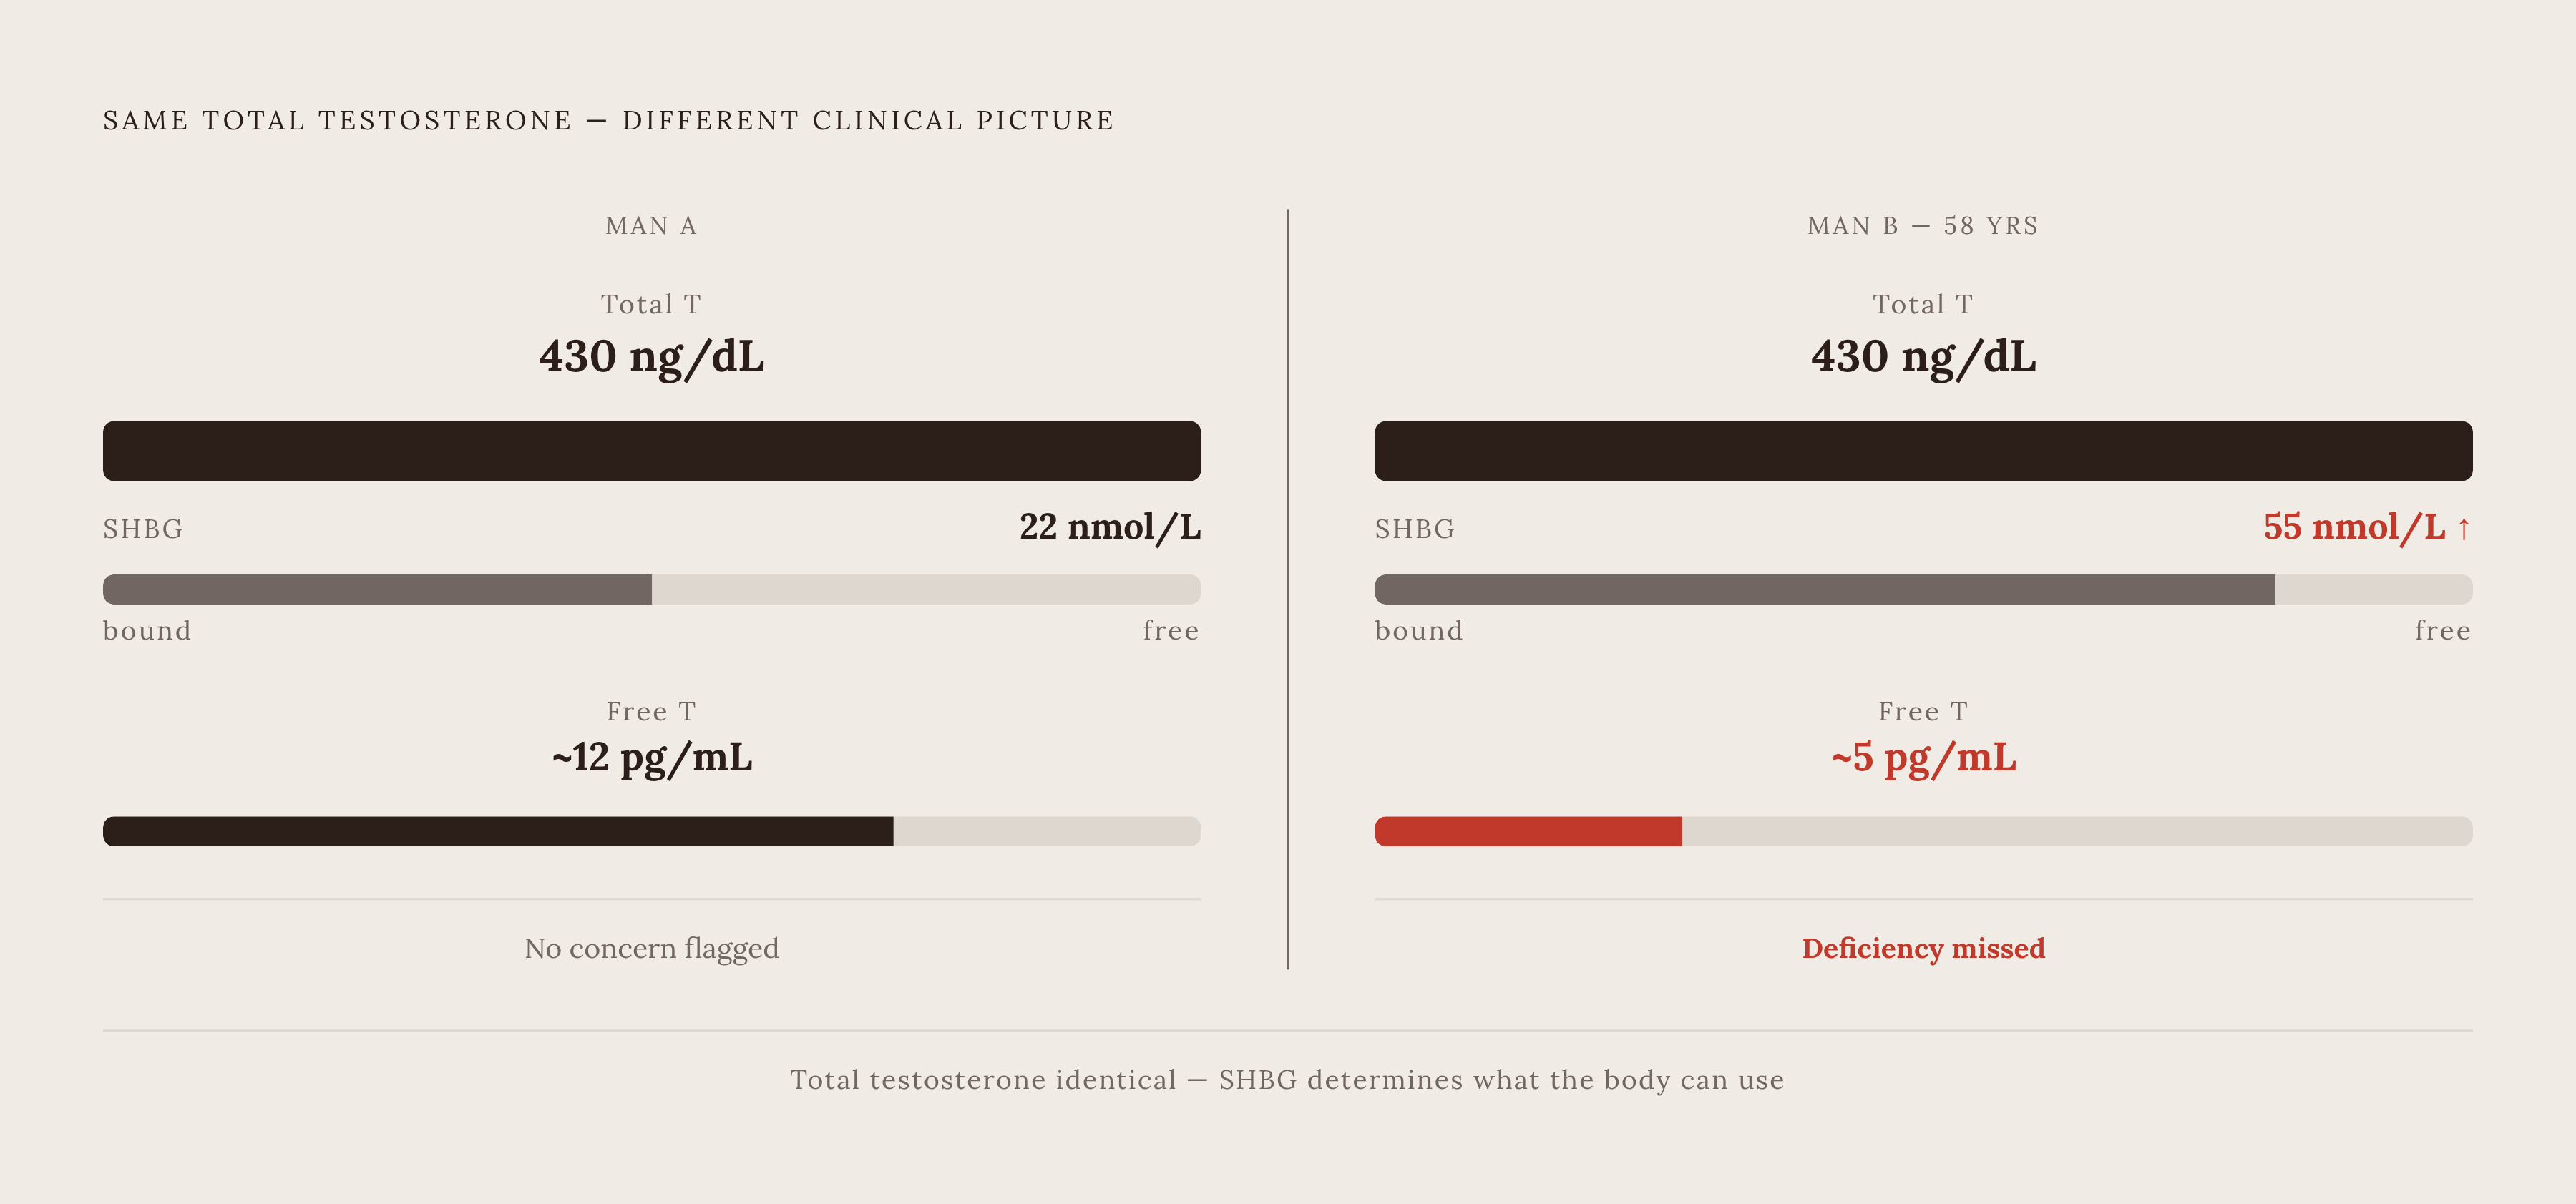
Consider an example of a 58-year-old man whose total testosterone is 430 ng/dL and whose SHBG is 55 nmol/L. The total result may receive no flag. Yet his SHBG could leave his free testosterone low enough to raise concern about a clinically significant deficiency. If he also has symptoms, stopping at total testosterone would miss the question that needs answering.
The reverse can be difficult to interpret too. Very low SHBG can make calculated free testosterone look adequate even when the other clinical findings are hard to make sense of. A 2025 JCEM Case Reports case study described near-absent SHBG with marked biochemical abnormalities but no clinical hypogonadism. The case shows how extreme binding-protein values can make calculated free testosterone less useful and why genetic analysis and the clinical context matter.
For someone in either situation, the lesson is not to diagnose from the calculation alone. The Endocrine Society’s 2018 clinical practice guideline recommends free testosterone measurement when total testosterone is borderline or a condition that alters SHBG is present.
What FSH and LH add to the picture — locating where the problem originates
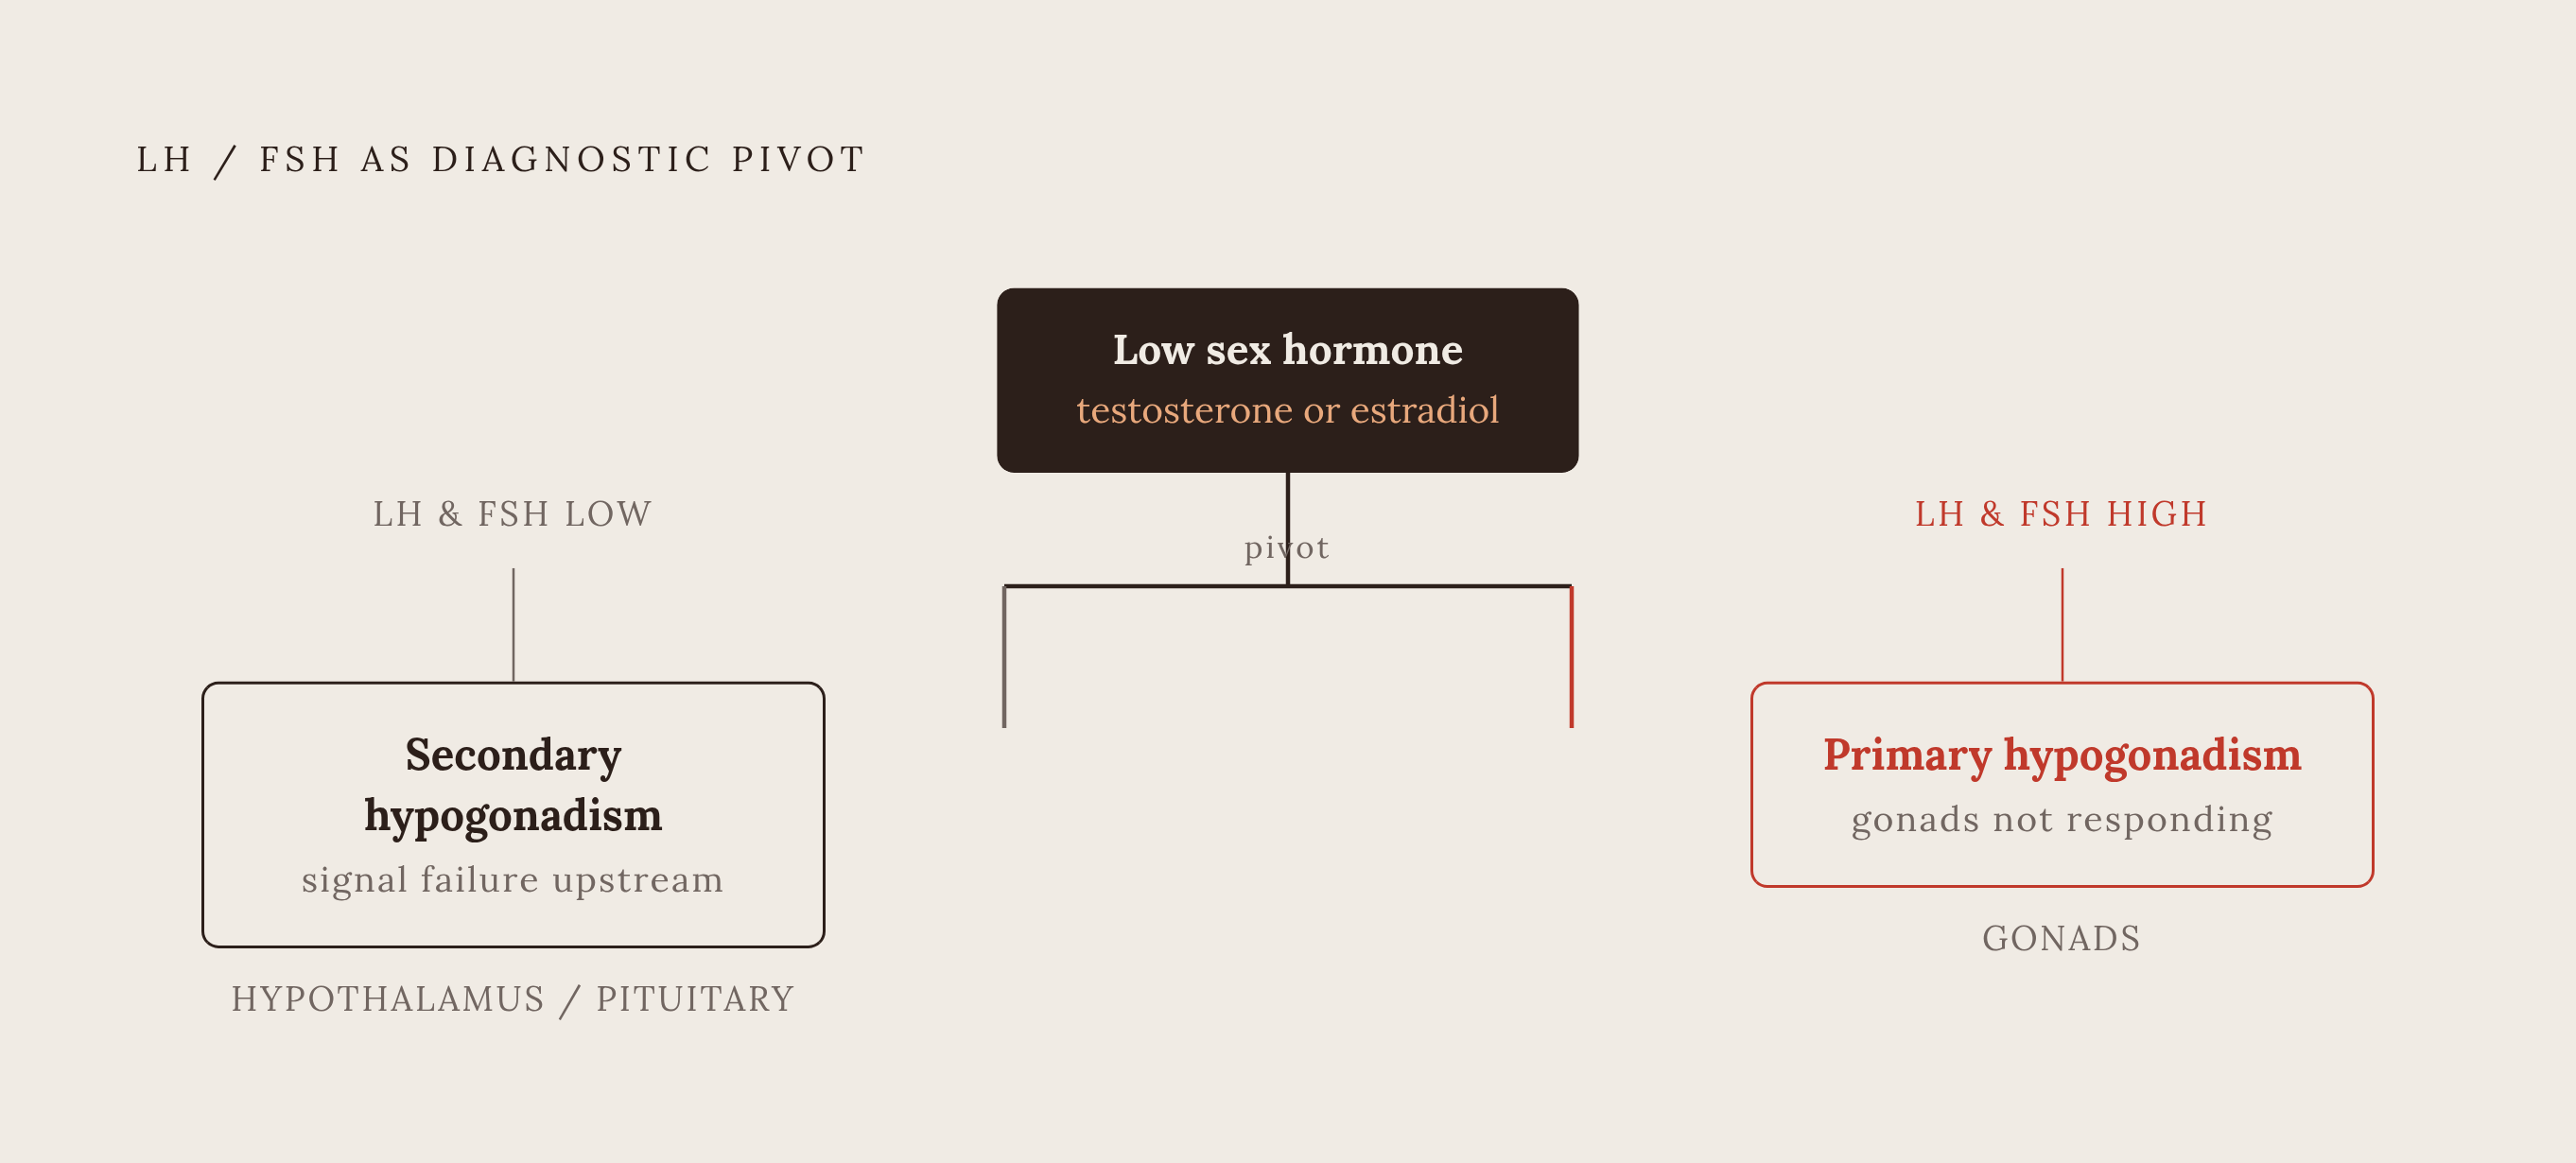
Where is a possible deficit coming from? LH drives testosterone production in men’s testes and triggers ovulation in women, while FSH governs sperm production in men and follicle development in women. These markers help distinguish a signaling problem from a problem in the gonads themselves.
When testosterone or estradiol is low and LH and FSH are also low, the pattern points upstream toward inadequate signaling from the hypothalamus or pituitary. This is the pattern of secondary, or hypogonadotropic, hypogonadism. Low sex hormones with elevated LH and FSH point in a different direction. The signaling system is working harder, but the gonads are not responding adequately, which is the pattern of primary hypogonadism.
In women, FSH also provides context about ovarian reserve and the menopausal transition, as rising levels signal reduced ovarian responsiveness. Low estradiol has different implications depending on whether FSH is high or normal. Research into this signaling axis is also active. A trial registered with ClinicalTrials.gov is evaluating LH and human chorionic gonadotropin in adults undergoing endocrine assessment, although a registration does not establish a finding.
Estradiol on a hormone panel — what it means for men and women, and why it is frequently misread
Estradiol is not relevant only to women’s panels. In men, it is produced through the aromatization of testosterone and is needed at normal levels for bone density, joint health, and mood. Levels that are too low or too high can cause problems. Elevated estradiol often reflects high total testosterone converting to estrogen, so its interpretation points back toward the testosterone results.
In women, cycle phase and menopausal status shape what an estradiol result means. FSH then helps distinguish the hormonal setting in which that value occurs. After menopause, estradiol below a clinically meaningful floor is associated with bone loss and vasomotor symptoms.
Measurement adds another layer at low concentrations. Immunoassays have limited precision in the ranges typical of men and post-menopausal women, while liquid chromatography-mass spectrometry, or LC-MS/MS, is the gold-standard method. The SHIP population study used LC-MS/MS to avoid those problems with reliability. An apparently precise number is only as informative as the method behind it.
How testosterone trajectories differ across age and sex — and why a single reference range obscures this
A 2025 study using LC-MS/MS found that concentrations declined until approximately age 58–59 years, then increased with age. The trajectory was not a straight downward line. A result for a 62-year-old woman therefore needs different age context from one for a 48-year-old, even if both sit within the same laboratory range.
Other androgens do not necessarily follow that pattern. Androstenedione and DHEA decline continuously with age in women, with the pattern observed from at least age 40 and beginning earlier, from the end of the second decade. DHEA-S falls substantially from its mid-20s peak across the lifespan in both sexes. That trajectory explains its use as a biological aging marker, although it does not settle the more contested question of supplementation.
In men, aging can change availability as well as production. SHBG tends to rise with age, progressively reducing free testosterone even when the decline in total testosterone is modest. The total result may therefore look more reassuring than the free result. Age changes how the other markers fit together.
How the 2026 EAU guidelines define biochemical confirmation of hypogonadism — and what they leave open
The 2026 EAU guidelines set a total testosterone threshold of ≤12 nmol/L, approximately 346 ng/dL, for diagnosing symptomatic male hypogonadism. The guidelines also support using SHBG and calculated free testosterone in the diagnostic pathway, particularly when altered SHBG complicates interpretation.
Direct measurement of free testosterone by immunoassay is unreliable and should not be used in place of calculated free testosterone. Equilibrium dialysis is the gold standard. Routine practice instead uses validated formulas, including Vermeulen and Mazer, to calculate free testosterone.
The threshold helps establish whether findings and symptoms support hypogonadism, while a baseline can show whether a person’s levels have changed. A low free testosterone result on its own, without symptoms, is not enough to diagnose hypogonadism. Conversely, the absence of an earlier baseline limits what can be said about whether an in-range value represents a meaningful personal decline.
What the cardiovascular evidence says about testosterone levels — and what it does not support
The TRAVERSE trial showed non-inferiority for major adverse cardiovascular events in patients at high risk. The FDA responded in 2025 by removing the boxed cardiovascular warning from testosterone labels while adding a blood-pressure warning. These findings weaken a blanket claim that cardiovascular danger should prevent treatment of symptomatic men with genuine deficiency. They do not remove the need to consider risk.
Restoring deficiency and pursuing high-normal levels are different propositions. A Mendelian randomization analysis linked genetically higher circulating testosterone to a greater risk of coronary artery disease, with an odds ratio of 1.17, likely in part because of blood pressure. That finding challenges the claim that a higher testosterone number is automatically better for longevity, although it does not directly measure the effects of a treatment decision.
The evidence also remains insufficient to make broad claims about endogenous sex hormones and mortality in people with established cardiovascular disease, especially women. Uncertainty cuts against confident marketing in either direction. Testing can help establish whether deficiency is present, but it does not turn the upper end of a reference range into a proven heart-health target.
Timing, fasting, and assay method — the pre-test decisions that determine whether results are usable
To make these distinctions usable in practice, the first step is to confirm the conditions of the blood draw. Testosterone is generally highest in the morning, and the clinically recommended testing window is between 7 and 10 AM. Repeat tests need comparable timing too. Comparing a morning result with an afternoon result can make a difference in collection conditions look like a hormonal trend.
The VA’s January 2026 clinical recommendations reinforce measuring total testosterone in a fasting state in the morning. Before testing, check the fasting instructions and the time of the appointment. For women, the cycle phase also needs to be known when interpreting estradiol and progesterone. Otherwise, the result may reflect sample timing, obscuring the hormonal concern being investigated.
The measurement method belongs in that same conversation. Ask which assay will be used, particularly when concentrations are expected to be low, as in women and older adults. If free testosterone is included, clarify whether it is calculated with a validated formula or measured by an appropriate method.
What to do when results come back and something looks off — or everything looks "normal" but symptoms persist
When a result is flagged, the next step is to interpret it with the surrounding markers and symptoms. A low testosterone result paired with high SHBG raises a different question from one paired with low LH and FSH. Estradiol likewise needs its hormonal and life-stage context.
When nothing is flagged but symptoms remain, it is especially important to read the results in the same way. Ask the clinician whether free testosterone and SHBG have been assessed where total testosterone is borderline or altered SHBG is suspected. The Endocrine Society guideline supports that targeted follow-up.
For adults considering proactive testing, a personal baseline offers a different kind of value. It provides a reference point for later results, especially when those results remain inside the population range. Comparable measurements over time can distinguish stability from personal change. Those measurements give a future clinician context beyond a single “normal” flag.
Sources
- Association of sex hormones with physical, laboratory, and imaging markers of anthropometry in men and women from the general population
- EAU Guidelines on Sexual and Reproductive Health: A Summary of the 2026 Recommendations for Measurement and Biochemical Confirmation of Hypogonadism - European Urology Focus
- Evaluation of the Role of Luteinizing Hormone (LH) and Human Chorionic Gonadotropin (hCG) in Adult Patients Undergoing Assessment for Endocrine Disorders
- Evaluation for and Management of Males with Low ...