Fasting Insulin Reference Ranges for Metabolic Health
Fasting insulin catches metabolic damage a decade before standard glucose tests will.

The blood test you got back says your glucose is normal. Your HbA1c is normal. Yet your pancreas could already be working twice as hard as it should, and no standard lab value would flag it. That is the blind spot fasting insulin exists to close, and this piece explains how to read it.
Why fasting insulin is the metabolic marker most standard bloodwork skips
Fasting insulin measures how much insulin your pancreas must produce after an overnight fast of 8 to 12 hours to keep your blood glucose stable. Insulin is a hormone made by the beta cells of the pancreas. Its job is to escort glucose from the bloodstream into muscle, liver, and fat cells for energy. In a metabolically healthy person, the fasting level is low because the system is efficient. As cells become resistant to insulin's signal, the pancreas compensates by secreting more insulin to achieve the same glucose-clearing effect.
The standard preventive panel looks at fasting glucose and HbA1c, which are downstream outputs. A person whose fasting glucose is 93 mg/dL and HbA1c is 5.2% may be running their pancreas at double the insulin output required for a genuinely insulin-sensitive person. No standard lab value will show it.
Why does this matter beyond diabetes? Fasting insulin is clinically significant across a wide range of downstream conditions: cardiovascular disease, visceral fat accumulation, PCOS, non-alcoholic fatty liver disease, hormonal imbalances, and cognitive decline. That stage is invisible to glucose and HbA1c.
How the standard reference range was built, and why it does not mean metabolically healthy
The standard lab reference range for fasting insulin typically runs from 2 to 25 µIU/mL. That range was derived from population averages, not from a population selected for metabolic health. Reference ranges are set statistically: the middle 95% of a tested population defines normal. The problem is that the population includes large numbers of people with undiagnosed early-stage insulin resistance who have not yet crossed into diabetes. The upper bound is inflated by the very dysfunction the test should catch.
A result of 20 µIU/mL will not trigger a flag on a standard lab report. But from a metabolic health standpoint, that same number means significant insulin resistance. The lab is not wrong. It is answering a different question than the one you want answered.
A second compounding problem is assay non-standardization. Insulin is not measured by a universally calibrated method, so the same blood sample tested on three different platforms can return three different numbers. Compare your result against the range printed on that specific lab report, not against a number from a different source.
When researchers build reference ranges from genuinely healthy cohorts, the ceiling drops. The Tehran Lipid and Glucose Study screened 309 non-obese healthy adults and established a 95% reference range of 2.11 to 12.49 µIU/mL, far narrower than the standard lab ceiling. A 2024 study in the Archives of Endocrinology and Metabolism found a 95% reference interval of 2.52 to 13.14 µIU/mL in an adult population. Start with metabolically healthy people and the upper bound of normal falls by roughly half.
The implication is direct. A result the lab prints as normal can simultaneously represent meaningful metabolic risk. That is why clinicians working in metabolic health use a different target entirely.
The metabolic-optimal range and what each zone on the spectrum actually signals
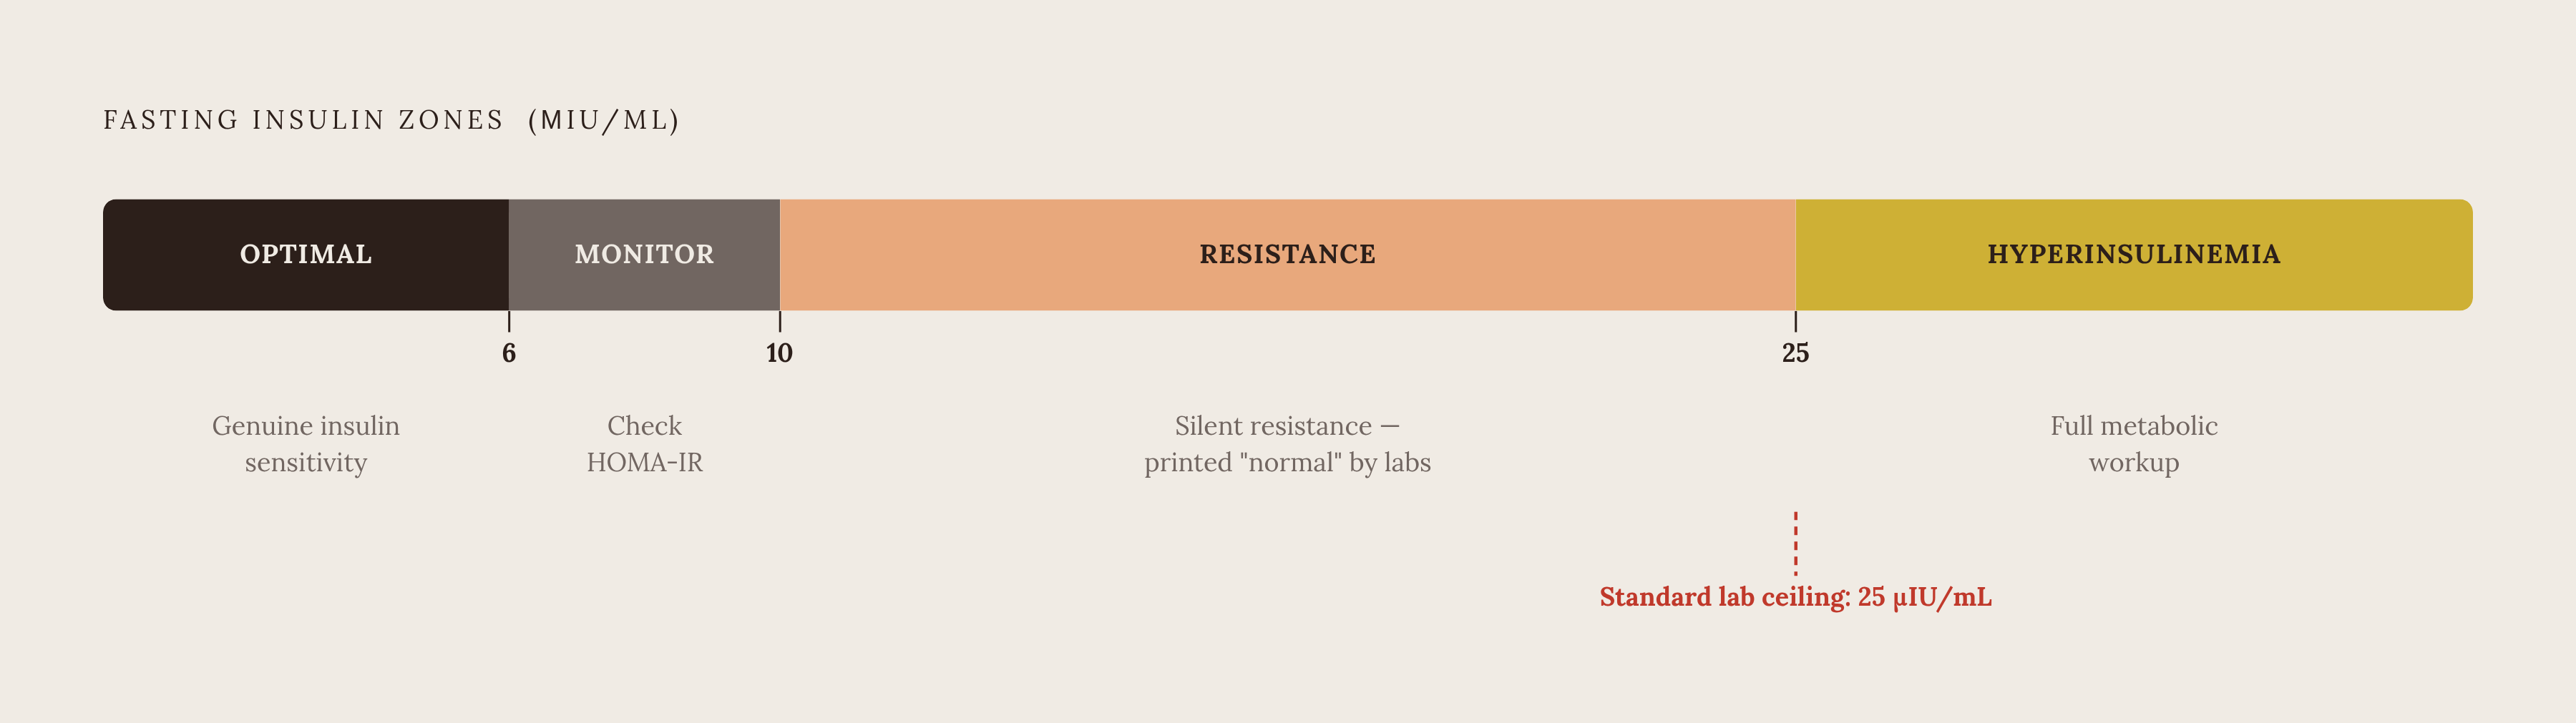
Metabolic health clinicians use a narrower functional range, with under 6 µIU/mL as the optimal target. That target reflects values associated with genuine insulin sensitivity rather than the absence of diagnosed disease. Between 10 and 15 signals mild to moderate insulin resistance, where intervention is warranted. Between 15 and 25 represents significant insulin resistance. Above 25 crosses the standard lab ceiling entirely and signals significant hyperinsulinemia, so a full metabolic workup is indicated.
No universally accepted optimal threshold exists. The practitioner community uses roughly 2 to 10 µIU/mL as favorable, with the most conservative longevity-oriented clinicians targeting under 6. The under-6 target is used because it associates with the lowest risk in outcomes research, not because an official body endorsed it.
The strongest objection to treating any single threshold as definitive comes from a 2025 Nature Communications Mendelian randomization study. It found that elevated fasting insulin does not carry uniform risk. Researchers identified clusters of genetic variants that raise insulin without raising type 2 diabetes risk, a state called non-diabetogenic hyperinsulinemia, and these clusters showed mixed cardiovascular associations. The source of the elevation may matter as much as the number: fat redistribution, compensatory secretion, and reduced hepatic clearance carry different risk profiles.
So what do you do with that? Interpret it in context, with HOMA-IR, fasting glucose, triglycerides, HDL, and clinical history. A single lab range is insufficient because context changes what the number means. That is the practical takeaway, and it leads directly to the next question: how early does this marker actually move?
Why fasting insulin catches insulin resistance years before glucose or HbA1c does
Fasting insulin rises while glucose is still perfectly normal. As insulin resistance develops, the pancreas increases output to keep glucose in range. By the time fasting glucose hits 100 mg/dL, the pancreas may have been overproducing insulin for a decade or more. Research cited in functional medicine literature places the lead time at 10 to 20 years between the start of insulin resistance and the point where fasting glucose crosses a diagnostic threshold.
That lead time is the entire value proposition. Fasting insulin rises before fasting glucose, before HbA1c, and often a decade or more before a clinical type 2 diabetes diagnosis. During that window, metabolic damage accumulates even though no standard lab value crosses a threshold. The pancreas is working harder than it should to maintain the appearance of metabolic health, a state called compensated insulin resistance.
The dose-response relationship makes the window actionable. Risk rises incrementally with each unit of fasting insulin increase above 5 µIU/mL, even within the conventional normal range. A result of 14 µIU/mL is not equivalent to a result of 8 µIU/mL in risk terms, even though both would be labeled normal on a standard lab report. Pairing it with glucose sharpens the picture.
HOMA-IR: how combining fasting insulin with fasting glucose sharpens the picture
Combining fasting insulin with fasting glucose into a HOMA-IR calculation gives a more complete picture of insulin resistance than either value alone. The formula is simple: HOMA-IR equals fasting insulin in µIU/mL multiplied by fasting glucose in mg/dL, divided by 405. Here is a worked example. A person with a fasting insulin and fasting glucose in the typical range will have a HOMA-IR in the insulin-resistant range, not the optimal one. The calculation captures both the level of insulin required and the glucose level being maintained, reflecting the overall efficiency of the system rather than a single variable.
Optimal HOMA-IR sits at approximately 1.0 or below. Above 1.9 signals early insulin resistance. A March 2026 Nature study used HOMA-IR as a ground-truth benchmark to train deep neural network models that predict insulin resistance from wearable device data and routine blood biomarkers. That makes it practically useful: you can calculate your starting HOMA-IR, adopt an intervention, retest, and measure actual change against a number that maps directly to the evidence on what works.
How age, sex, and life stage shift what a fasting insulin number means
A single universal threshold for fasting insulin is biologically imprecise because insulin levels shift predictably across life stages and between sexes. Children before puberty run lower than adults, and pediatric reference values are not commonly reported in routine practice because the fasting sampling protocol is rarely applied in this age group. Adolescents temporarily spike upward during puberty. Pregnancy roughly doubles fasting insulin by the third trimester. Postmenopausal women shift toward higher levels as estrogen's insulin-sensitizing effect declines.
These variations mean the optimal range of 2 to 6 µIU/mL applies most cleanly to non-pregnant adults. A result in the 6 to 10 zone warrants different clinical weight depending on whether the person is a 25-year-old man, a 55-year-old postmenopausal woman, or a teenager. Knowing whose body the number came from is part of reading it correctly.
What elevated fasting insulin does to the cardiovascular and metabolic system over time
Chronically elevated fasting insulin is not just a marker of risk. It actively drives the metabolic and cardiovascular conditions it is associated with, through mechanisms that accumulate long before a clinical diagnosis. When chronically elevated, insulin is also a potent growth factor, an established cancer-risk-promotion mechanism.
A 2025 study in the Journal of Health, Population, and Nutrition analyzed a large population and found different insulin resistance indices were each associated with subsets of chronic diseases including hypertension, heart disease, dyslipidemia, hyperuricemia, and chronic kidney disease. No single index was significantly associated with all five, but the burden of multiple chronic diseases increased with worsening insulin resistance across all five indices studied. The finding is not limited to diabetic populations. It applies across the full spectrum of insulin resistance severity, which means a result within the standard lab's normal range but above the metabolic-optimal target is already part of this spectrum.
If you track ApoB, the connection is direct. Researchers have investigated the intersection of fasting insulin, fasting glucose, and ApoB in individuals without diagnosed diabetes, finding that insulin dysregulation is implicated in cardiometabolic risk beyond glycemia. The damage is already happening while insulin is elevated. That is what makes the lead-time window an opportunity rather than just a warning.
Lifestyle changes with the strongest evidence for reducing fasting insulin
Fasting insulin is one of the most modifiable metabolic markers you can track. The interventions with the strongest evidence target glucose load, skeletal muscle insulin sensitivity, or the length of daily fasting periods. A 2026 meta-analysis of randomized controlled trials found that low-glycemic-index diets combined with calorie restriction significantly reduced fasting insulin and HOMA-IR in children and adolescents with overweight or obesity. Plant-based diet interventions have shown significant within-group reductions in fasting glucose, fasting insulin, and C-peptide.
Resistance training 3 to 4 times per week builds skeletal muscle mass, the body's primary site of glucose disposal, which directly improves insulin sensitivity. Post-meal walks of 10 to 15 minutes lower acute glucose and insulin response. Reducing sedentary time throughout the day matters independently of formal exercise.
What about intermittent fasting? Evidence is mixed, so be precise about what the research actually supports. A 2025 systematic review and meta-analysis with GRADE evaluation found that intermittent fasting improves metabolic outcomes in metabolic syndrome, with HOMA-IR showing meaningful reduction. The effect is duration-dependent: interventions lasting more than 8 weeks produced a greater effect size than shorter ones, which showed a smaller but still statistically significant effect. Subgroup analyses showed greater reductions in fasting blood sugar, HOMA-IR, and HbA1c among participants under age 50. The most consistent effects appear in metabolic syndrome populations and with longer intervention durations.
Sleep and stress sit upstream. Stress management practices that reduce cortisol load have downstream effects on insulin sensitivity. Targeted supplements appear in the sources as an adjunct, but the trial evidence leads with the lifestyle interventions above.
How to get a fasting insulin test, what to order alongside it, and how to read what comes back
Fasting insulin is a straightforward blood test available through direct-to-consumer lab services without a doctor's referral. The most informative order pairs it with fasting glucose so HOMA-IR can be calculated from the same draw. The test requires an 8 to 12 hour overnight fast. Water is permitted. Coffee and other caloric or stimulant intake should be avoided, as they can affect insulin levels.
When you get the result back, apply the framework. Apply the functional stratification: under 6 µIU/mL is the metabolic-optimal target, 6 to 10 warrants monitoring and a HOMA-IR calculation, and above 10 warrants structured intervention. Interpret the number in the context of age, sex, and life stage. A postmenopausal woman and a 30-year-old man should not apply identical thresholds without adjustment. Compare your result against the range printed on the specific lab report, not against converted values from a different platform, because assays are not standardized.
Fasting insulin is most valuable as a trend marker. A single result is informative, but testing annually and tracking direction over time reveals whether the metabolic trajectory is improving or worsening, and whether lifestyle changes are working. A clinician-reviewed result, where a practitioner interprets the number in the context of the full metabolic picture, is more actionable than a raw number read in isolation. You now have the knowledge to interpret your result correctly, ask for the right test, and act before glucose becomes the problem. The sources checked for this guide are listed below.