Coronary Artery Calcium Score and Lifetime Cardiovascular Risk
The calcium in your arteries reveals decades of damage, not today's risk factors.

A coronary artery calcium (CAC) score is a measurement of damage already done, not a reading of what's happening in the blood today.
What it produces is an Agatston score, a number derived from how much calcified plaque sits in the walls of the coronary arteries. That calcium is embedded in the artery wall, usually as part of older, more stable plaque that built up over years of exposure to cholesterol, inflammation, and metabolic stress. Calcium is part of how the body tries to heal and stabilize damaged tissue. But its presence in a coronary artery confirms that atherosclerosis has already started, and the amount of it tells you roughly how far that process has gone.
Compare that to a cholesterol panel. An LDL-C test, even an advanced one, measures what's circulating in the blood at the moment the sample was drawn. It's a snapshot of risk factors, not a measurement of accumulated harm. A patient can have a high LDL today and a low CAC score, if the exposure is recent. A patient can have a low LDL today and a high CAC score, if decades of prior exposure already left calcified plaque behind. These are two different questions. One asks what's circulating right now and could still be changed. The other asks what the arteries have already been through.
The Agatston scoring scale breaks down into five bands: a score of 0 means no detectable calcium and very low risk, 1 to 10 indicates minimal plaque, 11 to 100 is mild plaque, 101 to 400 reflects moderate plaque burden, and anything above 400 is considered severe. Each range carries a different clinical weight, which the next sections unpack in more detail. For now, the distinction to hold onto is this: blood markers tell you what is circulating now. CAC tells you what your arteries have been through.
Why traditional risk calculators miss what CAC can see in asymptomatic adults
Risk calculators like the Framingham Risk Score and the pooled cohort equations work by inference. They take demographic and clinical inputs, age, blood pressure, cholesterol, smoking status, and run them through a formula built from population-level data. That approach has value, but it has a structural limitation: it estimates risk indirectly, based on what similar people have experienced, rather than measuring what's actually happening inside a given person's arteries. One might ask, if two people share nearly identical risk factor profiles, can a single formula capture that one of them has a clean set of coronary arteries and the other has significant calcified plaque? The data say no, not reliably.
CAC closes that gap. Research has shown a consistent, graded association between CAC and incident coronary heart disease events, independent of conventional risk factors, across a range of populations and study designs. The gap between calculator-based estimates and actual plaque burden is sharpest in people classified as low-to-intermediate risk, which happens to be exactly the group where clinicians face the most uncertainty about whether to start a statin or aspirin. A borderline score on a pooled cohort equation can hide very different underlying realities. Two patients can land on the same borderline number and have entirely different amounts of actual atherosclerosis once a scan is done.
That gap cuts in both directions. Traditional calculators can overestimate risk in some people and underestimate it in others, and a formula built on population averages has no way of telling the difference for a given individual. CAC tends to be more predictive of coronary events specifically than of stroke, functioning as a coronary-specific marker. None of this makes Framingham or the pooled cohort equations unreliable. It means they answer a different question than CAC does, and the two tools work better as a pair than either does alone.
What each score range means for 10-year cardiovascular risk
Once the Agatston number is in hand, the next question is practical: what does it mean for the next ten years? Data from the Multi-Ethnic Study of Atherosclerosis (MESA), one of the largest and longest-running studies on this subject, gives a fairly direct answer.
A score of zero carries what researchers describe as a "warranty period," a stretch of years during which short- to intermediate-term event rates are very low. That's a meaningful finding for someone who gets a scan back showing no detectable calcium. It's also not a permanent guarantee. The warranty period is useful for near-term clinical decisions, not a lifetime pass, and plaque can still begin accumulating after the scan is taken.
At the other end, scores above 100 consistently are in a 10-year ASCVD risk range at or above the threshold that guidelines use to justify starting a statin. Scores in the very high range identify patients with event rates that start to resemble those seen in people already being treated for established cardiovascular disease, even though the person getting the scan may have no symptoms. MESA data show hazard ratios approaching 4.6 for low-risk populations once CAC reaches 100 or above, a stark jump in risk. Someone sorted into a "low risk" bucket by a conventional calculator can be looking at nearly five times the coronary risk once the plaque burden is actually measured.
What matters about this gradient is that it holds up across age, sex, and race and ethnicity in the MESA cohort. It isn't a pattern limited to one demographic slice, which is part of why the score has earned the attention it has from cardiologists building treatment guidelines. A zero in a 45-year-old and a zero in a 65-year-old both carry favorable short-term implications, even though the baseline risk for those two people would look very different going in. The score gives each person an individualized number, not a population average dressed up as personal risk.
CAC Alongside ApoB, LDL-C, hsCRP, and Blood Glucose
CAC and blood-based markers aren't in competition with each other. They sit at different points along the same timeline. Blood markers capture what's circulating and modifiable right now. CAC captures the structural damage that has already accumulated. Put together, they answer two separate questions: how much has already happened, and what's currently driving risk forward.
LDL-C remains the traditional lipid target and the basis for most statin-prescribing decisions, but it measures cholesterol mass rather than the actual count of atherogenic particles. ApoB fills that gap by measuring particle number directly, one molecule per LDL, VLDL, or Lp(a) particle, and it predicts risk more accurately than LDL-C in cases where the two disagree. The 2026 ACC/AHA Dyslipidemia Guideline makes this explicit, noting that ApoB identifies residual cardiovascular risk in people already on statins, including those who've hit their LDL-C targets. That's a risk a CAC scan wouldn't catch in the gap between imaging studies, since scans aren't repeated often and blood draws can be.
hsCRP adds an inflammatory dimension that neither CAC nor the lipid panel captures on its own, and blood glucose tracks the metabolic stress that contributes to plaque formation over time. A patient with a low CAC score but rising ApoB or hsCRP is accumulating exactly the kind of exposure that tends to show up on a future scan, which makes those blood markers an early warning system. A patient with a high CAC score but well-controlled lipids and inflammation has real structural burden, but a more stable trajectory going forward, and that combination shapes how urgently and how aggressively a clinician might intervene. The guideline also folds metabolic markers into this picture directly, calling for intensified lipid-lowering therapy with specific LDL-C goals at intermediate CAC tiers. Reading CAC alongside ApoB, LDL-C, hsCRP, and blood glucose builds a more complete account of cardiovascular risk than any single test provides.
What the 2026 ACC/AHA guideline recommends by CAC tier
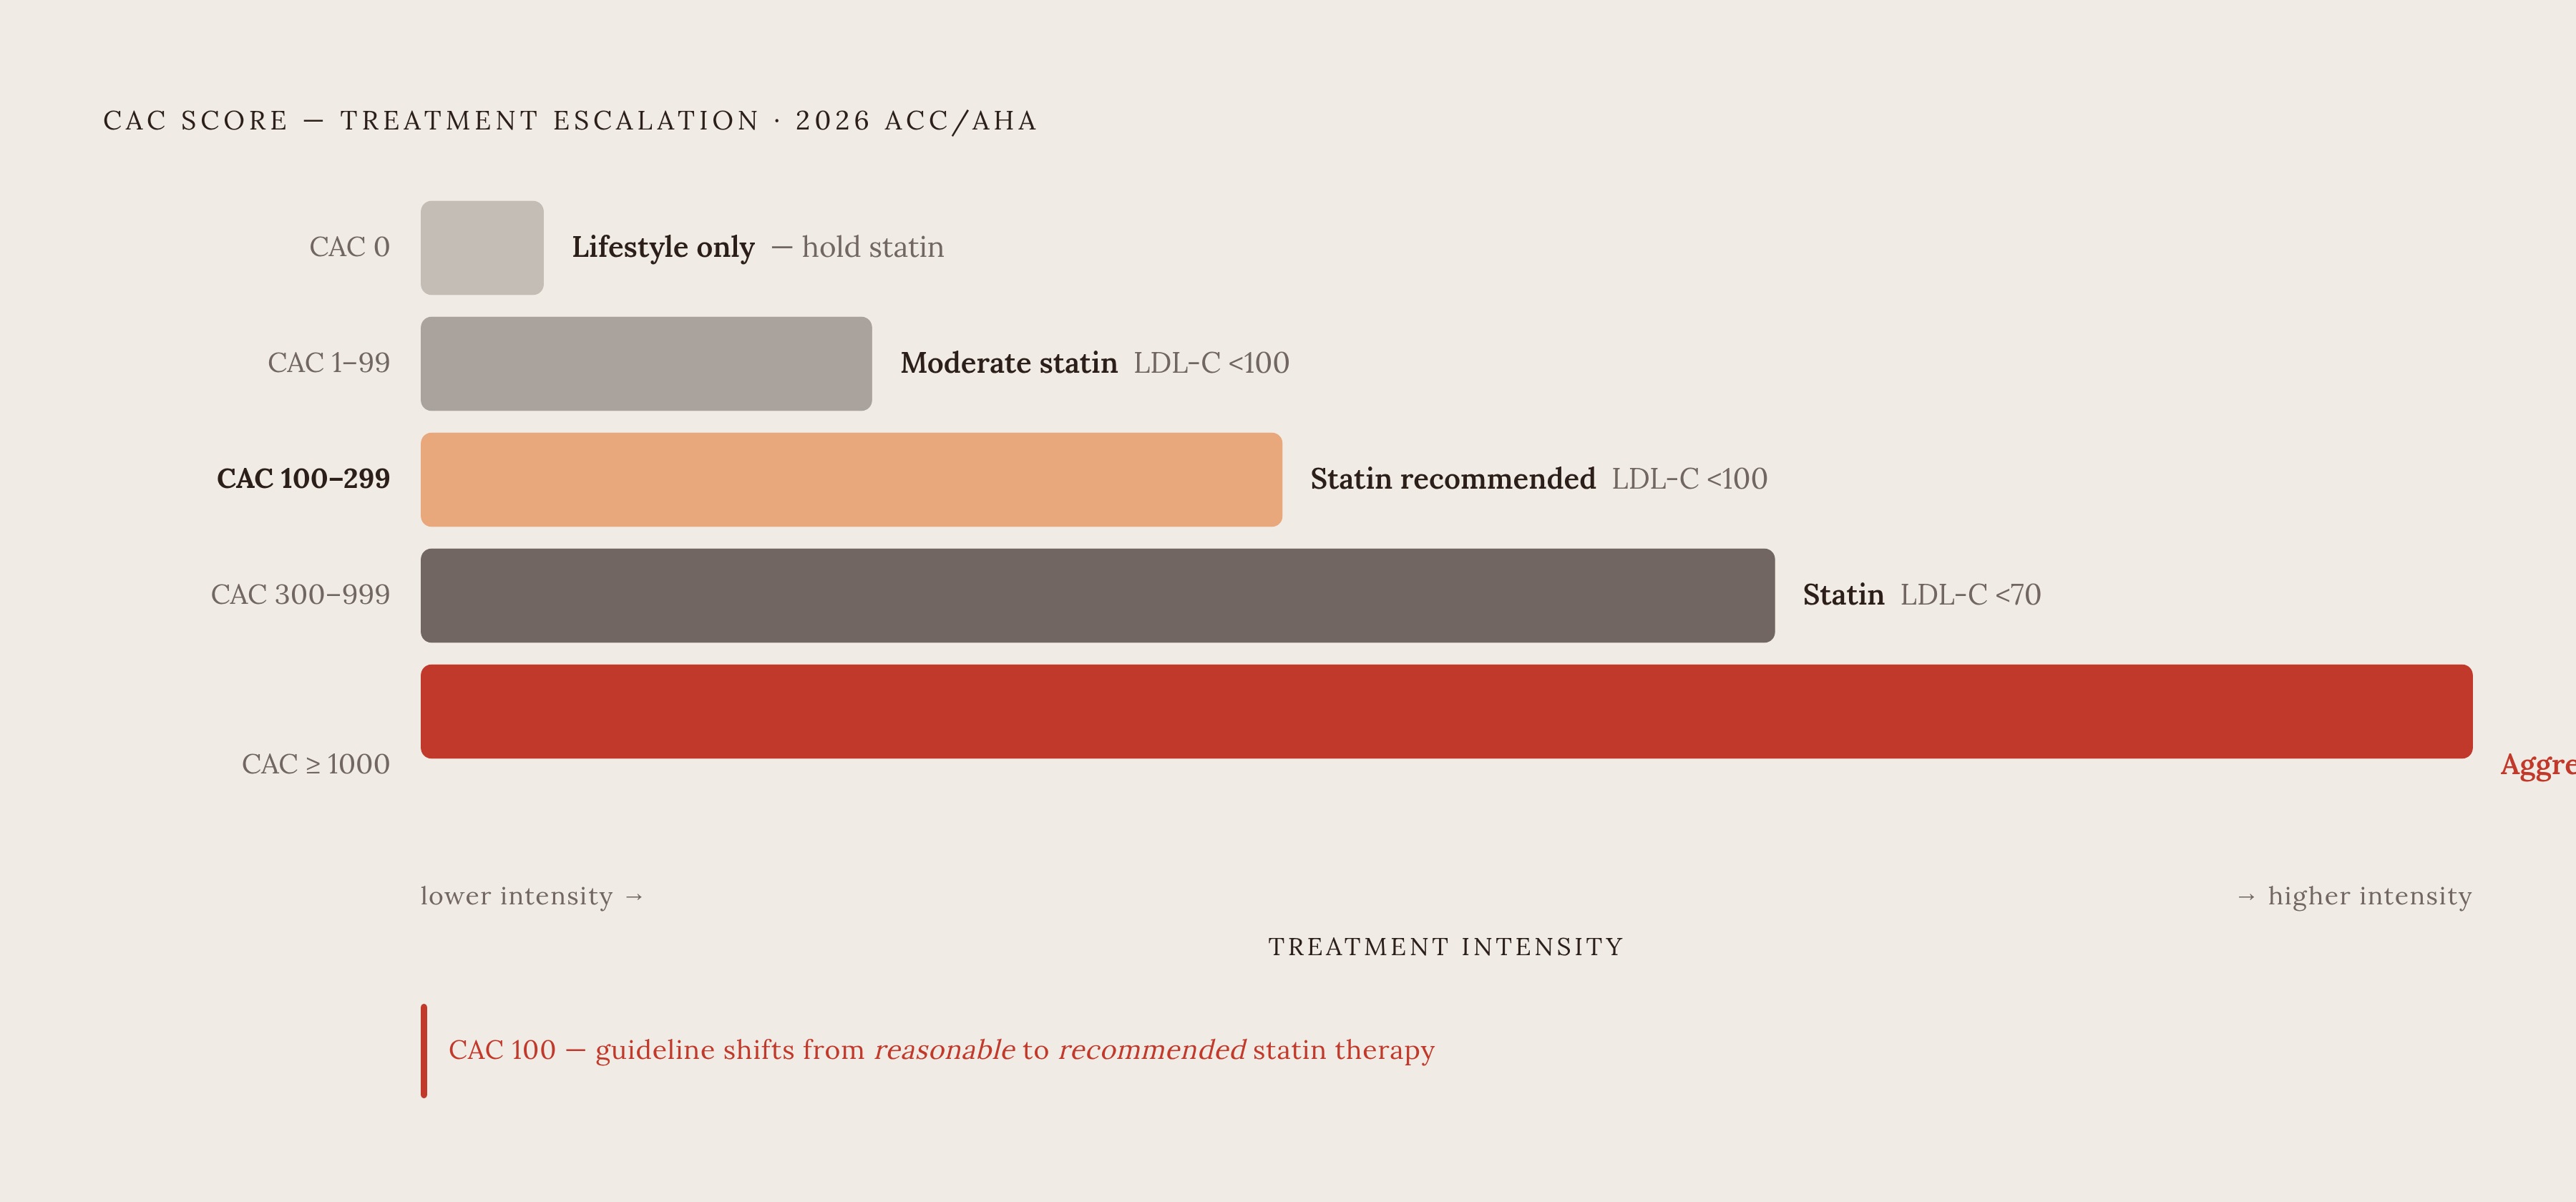
The 2026 ACC/AHA Dyslipidemia Guideline built a six-tier CAC framework directly into its treatment recommendations, making the score a working input into clinical decisions. At a CAC of zero, the guideline supports lifestyle optimization and holding off on statin therapy, assuming no other strong risk enhancers are present. In the 1 to 99 range, moderate-intensity statin therapy becomes reasonable, aimed at a meaningful LDL-C reduction and a goal of under 100 mg/dL, with no fixed age-55 cutoff built into that recommendation. Once the score reaches 100 to 299, or crosses the 75th percentile for age and sex, the guideline calls for starting lipid-lowering therapy, with a statin as the first-line choice. From 300 to 999, statin therapy remains first-line, aimed at a substantial LDL-C reduction with a goal under 70 mg/dL. At the very high end, the guideline calls for aggressive LDL-C lowering, with a target below 55 mg/dL, paired with closer follow-up.
What stands out about this framework is that it cuts both ways. A meaningful share of patients who would have been recommended for statin therapy under earlier guidelines could be reclassified, and potentially spared treatment they didn't need, once a CAC score of zero is factored in. The score escalates care for some patients and de-escalates it for others, which is a very different posture than a tool built only to flag more disease. The guideline also shapes which therapy gets used, not just whether treatment starts at all: for adults without a history of clinical ASCVD who experience statin-related muscle symptoms, and who are at high ASCVD risk or have a CAC of 300 AU or above, the guideline specifies bempedoic acid and/or ezetimibe to bring LDL-C below 70 mg/dL.
None of this is meant as a blanket screening tool. The guideline positions CAC as a selective test, recommended specifically when the decision about lipid-lowering therapy remains unclear after calculating PREVENT-ASCVD risk. It's a tiebreaker for uncertain cases, not a routine scan for every adult walking into a clinic. These tiers represent a guideline-level framework for how clinicians think through risk, not a substitute for an individual conversation about a specific patient's full picture.
The statin-calcium paradox that confuses patients on lipid-lowering therapy
A scenario that trips up a lot of patients doing everything right: someone starts a statin or a PCSK9 inhibitor, gets a follow-up CAC scan a year or two later, and watches the number go up. The instinct is to panic, to assume the treatment isn't working, maybe even to consider stopping it. That instinct, reasonable as it feels, is usually wrong.
Short-term increases in CAC after starting a statin or PCSK9 inhibitor shouldn't trigger alarm or a change in therapy, provided LDL-C targets are being met and the patient has no new symptoms. These increases are generally read as a sign of a plaque stabilizing, not worsening. The mechanism comes down to how the scoring works. Lipid-lowering therapy tends to densify existing plaque, making it harder and more structurally stable. The Agatston score weights lesion area by calcium density, measured in Hounsfield units, so denser plaque produces a higher number even as that plaque becomes less likely to rupture. A rising score, in this specific context, can be read as evidence the treatment is working as intended.
This is why serial CAC scanning isn't recommended as a way to track how well a treatment is working. Once therapy has started, the score becomes a poor short-term signal of progress, since it can rise for reasons that reflect improvement. CAC earns its keep before treatment decisions are made, when it's helping establish a baseline and guide a starting point. Once a patient is on appropriate therapy with LDL-C under control, blood-based markers, ApoB, LDL-C, hsCRP, become the better tools for tracking whether things are moving in the right direction.
Where CAC scores are weakest
CAC is a strong tool, but it isn't a complete one, and knowing where it falls short is part of using it well. A score of zero is not a rule-out for obstructive coronary artery disease. Younger patients with symptoms can carry dangerous non-calcified, or "soft," plaque that produces a CAC score of zero simply because it hasn't calcified yet. When clinical suspicion is high in a symptomatic patient, coronary CT angiography or functional testing fits the situation better than a calcium score. The test is structurally biased toward finding disease that has already hardened, so younger people and those in earlier stages of atherosclerosis may show artificially reassuring numbers.
The very high CAC tier, the group facing the steepest risk, is also the group with the thinnest evidence base. No dedicated randomized trials currently define the optimal LDL-C or glycemic targets for this population, and the role of newer therapies, PCSK9 inhibitors, bempedoic acid, GLP-1 receptor agonists, remains unclear specifically at this tier. Layered onto that, much of the existing research underrepresents younger adults, women, and non-European ethnic groups, which limits how confidently today's thresholds can be applied across every population walking into a clinic.
Women face a particular blind spot. Risk enhancers specific to women, pregnancy complications, autoimmune conditions, breast arterial calcification, aren't captured by a CAC score and need to be weighed alongside it. Sessions on women's cardiovascular health at the 2025 American Society for Preventive Cardiology pointed directly at these gaps in current risk prediction models. Rolling CAC out widely, outside the populations where it's actually been shown to change decisions, risks generating more downstream testing and cost without a matching gain in benefit. None of this undercuts what the test does well. It's a reason to use it where the evidence supports it, and to stay honest about the populations and scenarios where a number alone doesn't tell the whole story.
Sources
- Coronary artery calcium scoring in 2026: strengths, limitations, and optimized clinical use - PMC
- Coronary Artery Calcium Scoring for Risk Reclassification and Prediction of Hard Cardiovascular Events in Asymptomatic Adults at Low-to-Intermediate Cardiovascular Risk: A Systematic Review - PMC
- Beyond Traditional Risk Calculators: The Expanding Role of Coronary Artery Calcium Scoring in Preventive Cardiology
- 2026 ACC/AHA/AACVPR/ABC/ACPM/ADA/AGS/APhA/ASPC/NLA/PCNA Guideline on the Management of Dyslipidemia: A Report of the American College of Cardiology/American Heart Association Joint Committee on Clinical Practice Guidelines
- Reconciling Coronary Artery Calcification in the Lipid-Lowering Era